Table of Contents
Every few years, the same question lands in the inbox in a slightly different form. The market is down. How long until it comes back? It is a fair question, and it has an answer that is more useful than most people expect.
After more than 20 years of managing wealth for Australian families and business owners, the most reliable answer is not a forecast. It is a pattern. The pattern says that recoveries scale with the size of the fall, and that the long-term investor’s job is to plan for that pattern rather than react to it.
The drawdown recovery matrix
The table below summarises how long share markets have typically taken to recover from different sizes of fall. It is built from US market history, but the same shape shows up across most developed markets, including Australia.
| Drawdown size | Typical historical recovery time | Usually associated with |
|---|---|---|
| 5% to 10% (pullback) | About 1 month | Routine market noise |
| 10% to 20% (correction) | About 4 months | Growth scares, sentiment shifts |
| 20% to 40% (bear market) | About 15 months | Often associated with recessions |
| More than 40% (severe bear) | About 58 months | Deep recessions, structural shocks |
Two things stand out. First, smaller falls heal quickly. A pullback of 5% to 10% has typically been a one-month story. By the time the headlines catch up to the move, the recovery is already underway. Second, the relationship is non-linear. Doubling the size of a fall tends to more than double the recovery time. A bear market deeper than 40% can take roughly five years to make new highs, which is a very different planning horizon from a four-month correction.
Why falls greater than 20% tend to track with recessions
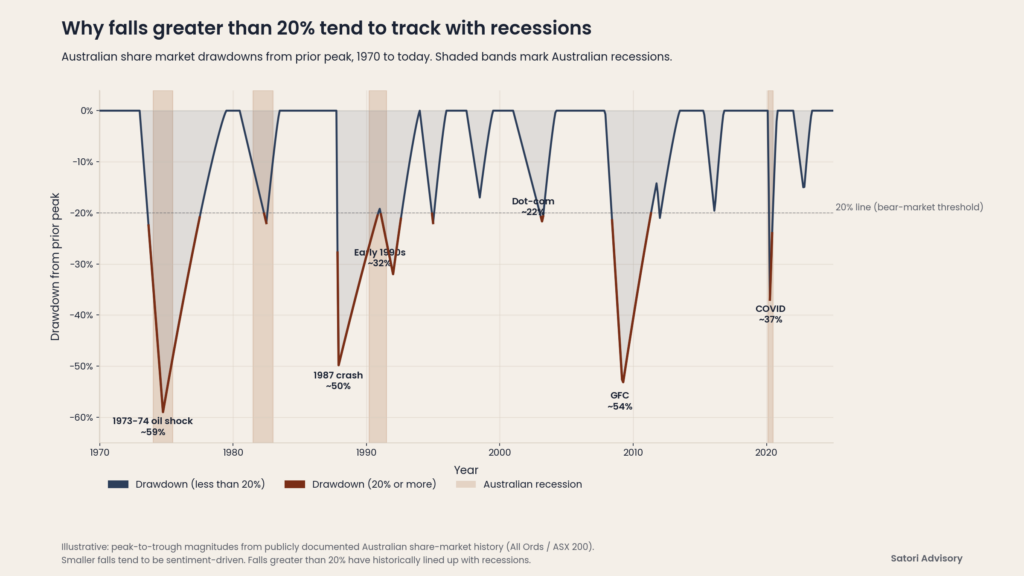
There is an important pattern hiding inside the matrix. Pullbacks and corrections (falls less than 20%) are often driven by sentiment, positioning and growth scares. They tend to repair themselves quickly because the underlying earnings picture has not changed much.
Falls greater than 20% are different. Historically, drawdowns of that size have tracked with recessions, where the earnings picture really does deteriorate, not just the mood. That is why recovery times stretch. The market is not just waiting for sentiment to repair. It is waiting for earnings to repair.
This is also why economists like Dr Shane Oliver at AMP keep coming back to the same baseline message in big drawdowns: the long-term approach is the right posture, even when the short-term picture is genuinely difficult.
Two questions every long-term investor should be able to answer
Cutting through the noise, there are really only two questions a long-term investor needs to be able to answer about their share portfolio.
- How often does a diversified share portfolio lose money?
- How long has it typically taken to recover?
Sitting with those two questions does something useful. It moves the conversation from ‘will the market come back?’ (a forecast) to ‘how do I want to be positioned for the range of recovery paths history shows me?’ (a plan). One you cannot control. The other you absolutely can.
Why most investors lose more to fear than to falls
Picking tops and bottoms is almost impossible, even for professional fund managers who stare at screens all day. The data on this is unforgiving. A small number of trading days drive a large share of long-term returns, and they tend to cluster close to the worst days.
Peter Lynch summarised this better than anyone:
“Far more money has been lost by investors preparing for corrections, or trying to anticipate corrections, than has been lost in corrections themselves.”
Sit with that for a moment. The cost of bracing for a fall, year after year, has historically dwarfed the cost of the falls themselves. Volatility is not the enemy of long-term returns. It is the price of admission.
What this means for your plan
Knowing the matrix is useful. Letting it shape your plan is more useful. A few practical implications fall straight out of it.
- Your cash and defensive allocation should be sized to your spending plan, not your fear level. Money you need inside the typical correction-recovery window should not be in growth assets.
- Your time horizon for growth assets should match the deepest plausible drawdown for your risk profile. If you cannot sit through a 40% fall for several years, your growth weighting is probably too high.
- Your rebalancing rules should be agreed in advance, in writing, so the next drawdown is met with a checklist rather than a guess.
- Your information diet matters more than most people realise. The closer you stand to the screen, the bigger every drawdown feels.
What to do next
If you are watching a drawdown right now and trying to decide what to do, the most useful question is not ‘how low can this go?’ It is ‘does my plan already assume something like this?’ If the answer is yes, the plan does the work. If the answer is no, that is the conversation to have, before the next move, not after it.
This is exactly the work we do quietly with our clients in the background. We model the recovery scenarios, pressure-test the cash buffer, and make sure the plan is built for the matrix above, not for the headlines of any given week.
How Satori Advisory works
At Satori Advisory we energise every part of your financial world. We integrate your tax, business, wealth and lending as a prosperity engine, aligned with what matters most to you. With a clear roadmap, informed by data and backed by decades of strategic experience, we simplify the complex. We do not offer pre-packaged solutions. We deliver tailored, end-to-end advice that reflects your reality and ambitions. You work directly with senior advisers who listen deeply, think boldly and act with purpose, supported by our trusted team and curated network of financial and business specialists, so you can realise your potential, powered by numbers.
Ready to talk?
If you would like a calm, no-pressure conversation about whether your portfolio is built for the next drawdown rather than the last one, we would be glad to set one up.
Call 1300 925 081 or email [email protected].
Or book a complimentary 30-minute meeting with one of our senior advisers.
Frequently asked questions
How long does it take stocks to recover after a 10% correction?
Historically, a correction of 10% to 20% has taken about four months to recover. Smaller pullbacks of 5% to 10% have typically taken about one month. The figures are averages across decades of data, so any single episode can be faster or slower.
How long does it take stocks to recover after a 20% bear market?
A drawdown of 20% to 40% has typically taken about 15 months to recover. Falls greater than 40% have taken longer, roughly 58 months on average, reflecting the deeper economic damage that usually drives them.
Do all market falls eventually recover?
Diversified share markets in developed economies, including Australia, have historically gone on to make new highs after every drawdown, although the time horizon varies widely. That is a historical pattern, not a guarantee, which is why the size of the fall and the size of your time horizon need to match.
Should I sell during a market drawdown?
Usually no, but the right answer depends on whether the fall is breaking your plan or just testing your nerve. Selling because the plan no longer works is rational. Selling because the headlines feel awful is the exact behaviour Peter Lynch warned about: investors typically lose more money preparing for and reacting to corrections than they lose in the corrections themselves.
What is the difference between a correction and a bear market?
A correction is a fall of around 10% to 20% from the previous peak. A bear market is a fall greater than 20%. The distinction matters because the deeper the fall, the more likely it is to be associated with a recession, and the longer the typical recovery.
Please feel free to get in touch on 1300 925 081 or send an email to [email protected] if you’d like to book in a chat on the above or on other matters.