
Table of Contents
Investors spend most of their attention on returns, and not enough on how returns are actually built. Total return is the sum of two things: the yield an asset pays you (dividends, interest, rent), and the capital growth in its price. When you change the starting yield, you change the most likely return.
A few years ago we reshared work from Dr. Shane Oliver’s 2020 outlook at AMP that captured this clearly. Mercer and Morningstar do similar work. The numbers below are from that projection set, and we use them here as a worked example of how to think, not a current forecast.
Yield plus capital growth equals total return
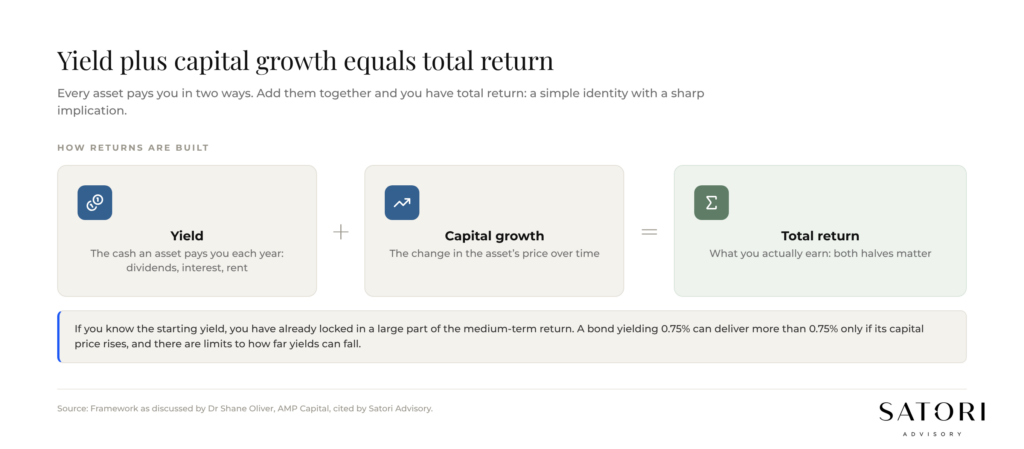
Every asset pays you in two ways. The yield is the cash it produces each year. The capital growth is the change in its price. Add them together and you have total return.
This is a simple identity, but it has a sharp implication. If you know the starting yield, you have already locked in a large part of the medium-term return. A bond yielding 0.75% can deliver more than 0.75% only if its capital price rises, and there are limits to how far yields can fall.
Why projected returns compressed
In March 2009 a similar projection of a diversified balanced growth mix sat at 10.3% per year. In Dr Shane Oliver’s later work the same mix was projected at around 4.8%. The collapse came from yields, not from any single asset class breaking. The figures below reflect the market as at the projection set date (circa 2020), and are included to show the mechanism, not today’s levels.
- Cash rate moved from around 14% in earlier decades to around 0.25%.
- Australian 10-year bond yields moved from around 13.5% to around 0.75%.
- Dividend yields on Australian equities compressed from around 6.5% to around 4.5%.
Layer in slower trend growth (household debt aversion, retreat from globalisation, US-China tensions, aging populations, online retail) and the capital growth half of total return also looks less generous than it did in prior decades.
Five implications for investors
Out of this work, five implications stand out for Australians building wealth in the current cycle:
1. Have reasonable return expectations
If a diversified mix is projected at around 4.8% per year over the medium term, planning models that assume 8% will eventually disappoint. We would rather underwrite plans on conservative assumptions and be pleasantly surprised, than the reverse.
2. More growth assets means more risk
Pushing for more return almost always means accepting more volatility. That is a feature, not a bug. The decision is not whether you accept risk, but where you accept it: in growth-asset allocation, in concentration, in time horizon, or in leverage.
3. Bear markets create opportunity
Lower expected returns from current prices imply higher expected returns from lower prices. Bear markets are the times when long-horizon investors quietly improve their future.
4. Real returns have not fallen as much as nominal
Headline yields have fallen sharply. So has inflation. Real returns (return minus inflation) have held up better than nominal returns, which softens the picture for a long-term investor focused on purchasing power.
5. Focus on assets with sustainable income flow
When the cash and bond rungs of the income ladder pay very little, sustainable income flow from equities, unlisted property, and infrastructure has to do more work in a portfolio. That is a structural shift, not a one-off.
Projected returns: a worked example
In Dr Shane Oliver’s projection set at the time, the medium-term annual returns looked broadly like this:
- World equities: around 5.8%.
- Australian equities: around 6.2%, lifting to around 7.2% with franking credits.
- Unlisted commercial property: around 6.5%.
- Infrastructure: around 6.9%.
- Australian bonds: around 0.9%.
- Cash: around 1.0%.
- Diversified growth: around 4.8%.
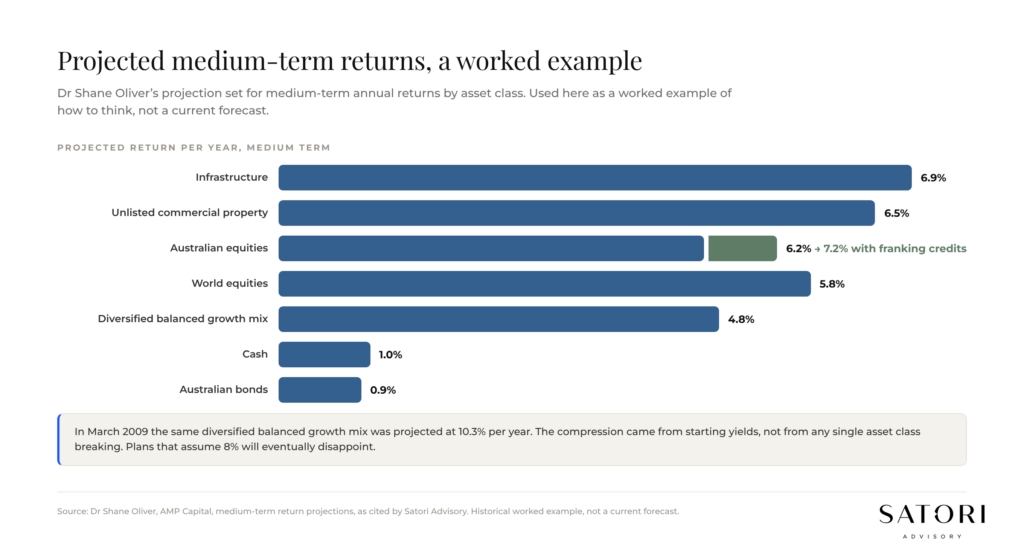
Two things stand out for Australian investors. First, franking credits matter: a 1% uplift on a 6.2% projection is more than 15% of the expected return, and it is unique to Australian equities for domestic taxpayers. Second, the gap between cash and growth assets is wide, which is exactly why staying in cash for too long has a real and measurable cost.
How we use this at Satori
We do not run portfolios on a single house view or a single forecast. We blend independent research from groups like Mercer and Morningstar with our own framework, then translate it into a strategy that fits each client’s structure.
Three things change once you accept that medium-term returns may be lower than the last decade:
- Saving and contribution rates carry more of the load. The plan needs to fund the goal even if returns disappoint.
- Asset allocation has to do real work. The default ‘balanced growth’ label can hide very different risk exposures.
- Tax efficiency, especially through franking credits, super contribution caps and entity structure, becomes a larger share of the realised return.
In other words, the search for returns is less about finding the next hot asset class. It is about building a structure that compounds reliably, in markets that may be less generous than they were.
How Satori Advisory works
At Satori Advisory we energise every part of your financial world. We integrate your tax, business, wealth and lending as a prosperity engine, aligned with what matters most to you. With a clear roadmap, informed by data and backed by decades of strategic experience, we simplify the complex. We do not offer pre-packaged solutions. We deliver tailored, end-to-end advice that reflects your reality and ambitions. You work directly with senior advisers who listen deeply, think boldly and act with purpose, supported by our trusted team and curated network of financial and business specialists, so you can realise your potential, powered by numbers.
Frequently asked questions
What is the total return framework?
Total return is yield plus capital growth. Yield is the cash an asset pays you each year (dividends, interest, rent). Capital growth is the change in its price. Together they form your total return, and starting yield drives a large share of medium-term outcomes.
What did Dr. Shane Oliver project for Australian investors?
In the projection set we discussed (published around 2020), Australian equities were projected to return around 6.2% per year over the medium term, lifting to around 7.2% with franking credits. A diversified balanced growth mix was projected at around 4.8%, well down from 10.3% projected in March 2009 in similar work.
Why do franking credits matter so much?
Franking credits are a refund of company tax already paid, attached to Australian dividends. For domestic taxpayers they can lift the effective return on Australian equities by around 1% per year, which is a meaningful share of the projected total return.
How should I set my own return expectations?
Use conservative assumptions in your plan, not optimistic ones. Underwrite the plan to survive a decade of lower-than-average returns. Focus on sustainable income flow, control what you can (saving rate, asset allocation, structure, tax efficiency), and let compounding do its work.
Ready to talk?
If you would like a calm, no-pressure conversation about the return assumptions inside your current plan, and whether they are conservative enough to survive a lower-yield decade, we would be glad to set one up.
Please feel free to get in touch on 1300 925 081 or send an email to [email protected] if you’d like to book in a chat on the above or on other matters.
Disclaimer
This article contains general information only and has been prepared without considering your objectives, financial situation or needs. It is not personal financial advice, taxation advice or legal advice and should not be relied upon when making financial decisions. Before acting on any information, consider its appropriateness to your circumstances and seek professional advice where appropriate.