
Table of Contents
Volatility in markets is not a defect. It is the mechanism. After more than 20 years working with Australian families and business owners, the families who do best across cycles are not the ones who predicted the next crash. They are the ones who held a plan robust enough to live through it.
This piece looks back across roughly 90 years of market history, drawing on a piece from the fund managers at Insync. The aim is not to glamorise crashes, it is to read them in their own numbers so the current week feels a little less unusual. The second half steps back to a 30 year view from Vanguard, showing how the ranking of asset classes shuffles every year, and why diversification matters so much in practice.
The seven biggest market events of the last 90 years
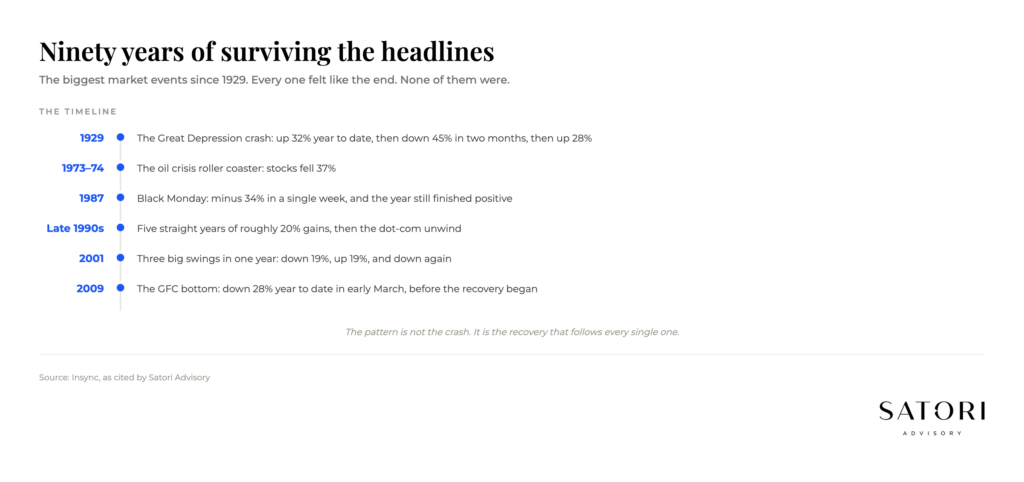
Large ups and downs occur all the time, even though the previous decade made many investors forget that. Here is how seven of the biggest market events in roughly the last 90 years actually played out, in their own numbers, drawing on Insync.
1929: the Great Depression Crash
The market was up 32 per cent year to date until peaking in September 1929. It then fell 45 per cent in two months, before rising 28 per cent. Overall, the year was down just 8.3 per cent. Four months into the next year, the market was up 22 per cent. That did not last. The next eight months saw a 44 per cent drop. By December the market was still down 25 per cent.
1931 and 1932: the worst year on record, then a 112 per cent rally
1931 had stocks rising 19 per cent in two months, then flipping to roughly minus 57 per cent by mid-December. The year closed down 44 per cent, the worst year on record.
Would you have stayed invested? Because 1932 then handed investors another 51 per cent drop over five months. As it turned out, that was THE bottom. Without warning or good news, markets rallied 112 per cent in only 12 weeks. The market still fell a further 32 per cent before settling the full year at minus 8.6 per cent.
Selling did not subside in 1933 either. There was another 25 per cent fall. Then investors enjoyed a staggering 121 per cent gain in July (and a separate bump of minus 29 per cent), to finish the year up 50 per cent, one of the best years ever. 1934 followed with another 21 per cent rise and a 29 per cent fall.
1973 to 1974: the oil crisis
The 1973 to 1974 oil crisis was another roller coaster. Stocks fell 37 per cent before bottoming in October, then rallied 21 per cent the next month, ending the year down roughly 26 per cent.
1980: large fall, larger recovery
1980 saw stocks fall 17 per cent, only to rise 43 per cent. The market was up 32 per cent by year end. 1982 looked similar: a 17 per cent fall followed by a 40 per cent jump, and a year end roughly 20 per cent higher.
1987 Black Monday: minus 34 per cent in a week, year still positive
Black Monday in 1987 saw the market fall 34 per cent in only a week, the worst one-day crash in history. It had risen 40 per cent beforehand and still ended the year almost 6 per cent up.
Late 1990s: five straight 20 per cent years, then dot-com
The late 1990s asset bubble had five consecutive years of roughly 20 per cent gains up until 1999, even though 1998 contained a 9.3 per cent fall before an eventual 34 per cent rise, closing the last year of the century at 28 per cent. As the dot-com bubble burst and 9/11 followed, 2001 had three big price swings: stocks fell 19 per cent, rose 19 per cent, then fell 26 per cent, to close the year roughly minus 12 per cent.
2009 GFC: the rally most investors missed
The 2009 GFC bottomed in early March at peak gloom, but not before being slammed 28 per cent from 1 January. Prices then leapt 67 per cent, closing the year up 26 per cent. The investor who left after the fall and waited for things to feel calm again missed the rebound that defined the decade.
What the 90 year scan actually teaches
Read those seven events as one set, not seven separate stories. The pattern is consistent. The worst weeks live inside years that often close positive. The worst years are followed by some of the strongest rallies in the data. And the rebound rarely waits for the news to feel safe. It arrives at the point of maximum gloom and explains most of the long-term return.
This is why short-term, sometimes violent swings in markets are the price you pay for the longer-term return. They are not a sign that something has broken. They are the mechanism. The investor who tries to dodge the worst weeks almost always misses the best ones too, because the best and worst days tend to cluster in volatile periods.
It is always important to bring context to investment decisions. Looking back over previous decades is a useful exercise, not because it predicts next year, but because it reframes what a single year is. A rough quarter is one tile on a very long mosaic.
30 years of asset class returns: the ranking shuffles every year
After the year-by-year scan, the second half of the picture is the long view. Drawing on Vanguard data covering roughly 30 years, the chart that matters tracks $10,000 invested in around 1990 across the major asset classes. Each line is a lesson in staying the course and playing the long game.
Two observations stand out.
First, cash quietly under-delivers. Cash continues to be classified as a ‘safe’ asset class. Once funds have been set aside for liquidity and contingencies, cash levels above certain thresholds start to look unsafe for most investors. The capital is preserved in name. Its purchasing power is not.
Second, the table of annual asset class returns shuffles every year. The Australian market in particular jumps around the table from one year to the next. Last year’s winner is rarely this year’s. Last year’s bottom is rarely the next year’s. That is the real argument for diversification, and it is why selecting a portfolio based on last year’s performance has tended to be one of the most expensive habits in investing.
Vanguard’s 30 year scan is a quiet companion to the 90 year volatility scan. The 90 year view says: stay invested through the storms. The 30 year view says: do not put all of your weight on one asset class, because the rank changes every year.
What this means for your plan
If the history feels familiar, the next move is not a new investment. It is a quieter audit of how your current plan would behave inside the next rough patch.
Three practical questions are usually enough.
- Does your asset allocation match your time horizon, or last year’s headlines? Money you genuinely will not need for 10 to 20 years does not belong in the asset class designed for the next 12 months.
- Is your portfolio diversified across asset classes, or concentrated by accident? If one asset class is doing most of the work, the next ranking shuffle will be uncomfortable.
- If markets fell another 20 per cent next quarter, what would your written plan tell you to do? If the answer is ‘I am not sure,’ the gap is not a market problem, it is a planning problem.
If those questions surface anything that is keeping you up at night, please reach out. We would rather have the conversation in a quiet week than in a loud one.
How Satori Advisory works
At Satori Advisory we energise every part of your financial world. We integrate your tax, business, wealth and lending as a prosperity engine, aligned with what matters most to you. With a clear roadmap, informed by data and backed by decades of strategic experience, we simplify the complex. We do not offer pre-packaged solutions. We deliver tailored, end-to-end advice that reflects your reality and ambitions. You work directly with senior advisers who listen deeply, think boldly and act with purpose, supported by our trusted team and curated network of financial and business specialists, so you can realise your potential, powered by numbers.
Frequently asked questions
What is the worst year on record for the stock market?
Based on the 90 year scan from Insync, 1931 is the worst year on record. Stocks fell roughly 57 per cent by mid-December and the year closed down 44 per cent. 1932 then handed investors another 51 per cent drop over five months before bottoming, followed by a 112 per cent rally in just 12 weeks.
Do large weekly falls usually mean the year will close negative?
Not always. In 1987, the market fell 34 per cent in a single week (Black Monday) and the year still closed up roughly 6 per cent. In 1929, the market fell 45 per cent in two months but the calendar year only finished down 8.3 per cent. The worst weeks frequently live inside years that close better than expected.
How did the 2009 GFC actually play out for investors?
The 2009 GFC bottomed in early March at peak gloom, with the market already down 28 per cent year to date. From there it rallied 67 per cent and closed the year up 26 per cent (Source: Insync). The investor who exited after the fall and waited for the news to feel safer typically missed the rebound.
Is cash really a safe asset class?
Cash is classified as ‘safe’ because the capital value does not fluctuate. Once funds have been set aside for liquidity and contingencies, cash levels above certain thresholds start to look unsafe for most investors because purchasing power erodes against inflation over time. The Vanguard 30 year asset class data illustrates how far cash falls behind growth assets across a working life.
Why does the ranking of asset classes shuffle every year?
Different asset classes respond to different conditions: interest rates, inflation, earnings cycles, currency moves, and global capital flows. The result, visible in 30 year Vanguard data, is that the Australian market and other asset classes regularly move around the annual return table. That shuffle is the real argument for diversification rather than chasing last year’s winner.
Ready to talk?
If you would like a calm, no-pressure conversation about how your investment plan is positioned for the next rough patch, we would be glad to set one up.
Please feel free to get in touch on 1300 925 081 or send an email to [email protected] if you’d like to book in a chat on the above or on other matters.
Disclaimer
This article contains general information only and has been prepared without considering your objectives, financial situation or needs. It is not personal financial advice, taxation advice or legal advice and should not be relied upon when making financial decisions. Before acting on any information, consider its appropriateness to your circumstances and seek professional advice where appropriate.