
Table of Contents
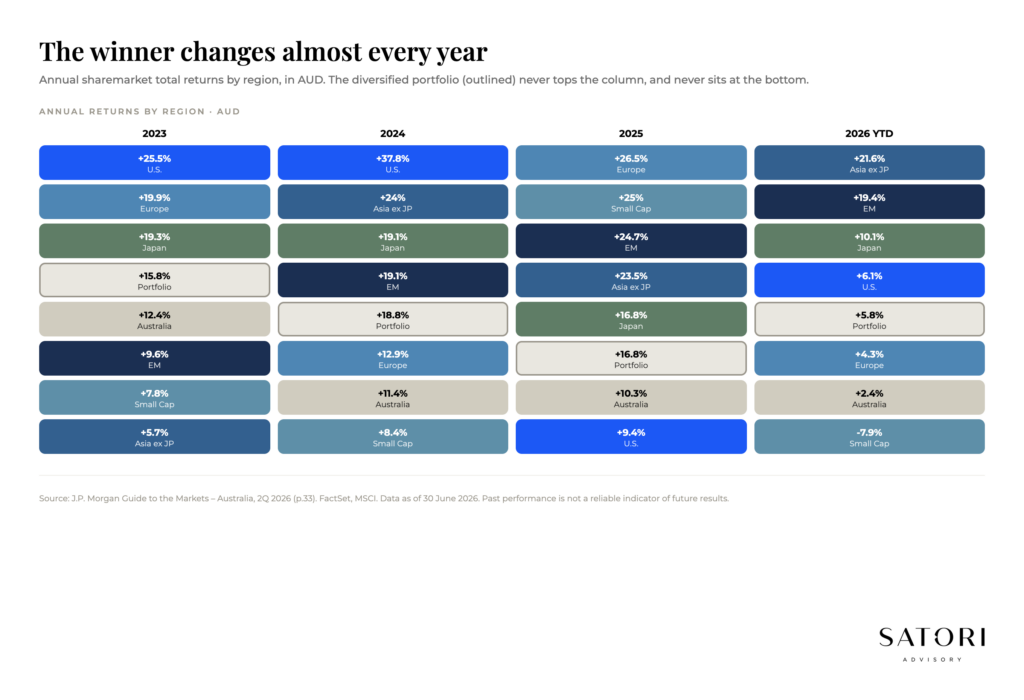
If you have ever stared at a quilt chart of regional sharemarket returns and felt your eyes glaze over, you are not alone. The colours look chaotic. The point is the chaos. Each colour is a region (Australia, US, Europe, Japan, Emerging Markets, and so on). The chart ranks them top to bottom each year, then shows a 10-year column on the right. The grey ‘diversified portfolio’ tile is what happens when you stop trying to pick a single winner.
It is one of the most useful pictures in investing because it shows you the truth about how markets actually behave. Below is what to take away from a decade of those tiles, and what to do with it in 2026.
What a quilt chart is really showing you
The first lesson is simple. Winners and losers swap around a lot. The market that looks unstoppable this year can be average next year, and the market that has been disappointing can suddenly become the best performer. Trying to pick the winner for a single year often feels like a casino, even when the analysis is sophisticated. Skill exists; the odds are stacked against short-term guessing once emotions are in the room.
10-year averages are the data worth respecting
Short-term performance is loud. Long-term performance is what pays. Anchor to 10-year cycles instead of 12-month moves and you reduce stress, and you reduce the chance your wealth strategy gets derailed by a bad year or a hype year.
Most investing mistakes happen when long-term assets get treated as short-term decisions
Selling a long-term position because of a 12-month move is one of the most expensive mistakes investors make. The chart shows you why. By the time most investors react, the leadership has often already rotated.
Why shares feel scary, and why they work anyway
Shares can feel wild and inconsistent because, in the short term, they are. Most people do not experience volatility as a normal feature of markets. They experience it as a signal to act. That is how investors end up selling after a fall and buying after a rise. The chart reminds you that negative years are not rare. In many cycles, expect a down year roughly every four to five years. It is part of the game and it is the entry fee for long-term returns.
The longer your timeframe, the more the ‘wildness’ tends to smooth out. This does not mean markets become predictable. It means the probability of a good outcome rises when you give compounding time to do its job.
What is happening with the US, Japan, and Emerging Markets
A few regions tend to get strong emotional reactions. Worth calling out:
Emerging markets: easy to hate, useful in moderation
EM has struggled in periods and can feel permanently disappointing. That does not make them useless. They are cyclical, often tied to currency, commodities, and global growth, and they can behave very differently to developed markets. That difference can be valuable in a diversified portfolio, even if the ride is bumpier.
Japan: still an interesting story even after a strong run
Even after meaningful gains, Japan has often been one of the cheaper developed markets compared to the US. Value can exist after a good run, depending on what earnings and valuations are doing underneath. The point is not to chase last year’s winner, it is to recognise that leadership changes and ‘cheap’ and ‘expensive’ matter over time.
The US: dominance and the concentration conversation
The US has been the headline winner for years. A large chunk of that has been driven by technology and IT, and a small group of names within it. The question is always sustainability. Some argue prices have outpaced reality. Others argue earnings growth has kept up and these companies are global businesses, not just US businesses. The honest answer is that nobody knows the short term. That is precisely why diversification matters. It lets you participate without pretending you can forecast perfectly.
What you are supposed to do with this information
This table is not telling you to jump from region to region each year. It is teaching you how markets behave so you can build a plan that works with reality instead of fighting it.
First, track a few coloured boxes and watch the journey they take
Pick two or three regions and follow them across multiple years. You will see how quickly the narrative changes.
Second, embrace the ups and downs
Volatility is not a bug. It is the mechanism that creates returns for long-term investors.
Third, focus on 10-year cycles
Short-term guessing will be stressful and it can derail your strategy. Long-term discipline is usually the advantage.
Fourth, project yourself forward
Imagine it is 2036 and you are looking back. Will you have wished you owned the world’s biggest and best businesses through a diversified strategy, even if some individual years looked messy? For most long-term investors, the answer tends to be yes.
How Satori Advisory works
At Satori Advisory we energise every part of your financial world. We integrate your tax, business, wealth and lending as a prosperity engine, aligned with what matters most to you. With a clear roadmap, informed by data and backed by decades of strategic experience, we simplify the complex. Long-term portfolio construction is one of the things we spend the most time on, because the simplest portfolio you can hold through cycles is usually the one most aligned to your goals. We do not offer pre-packaged solutions. We deliver tailored, end-to-end advice that reflects your reality and ambitions. You work directly with senior advisers who listen deeply, think boldly and act with purpose, supported by our trusted team and curated network of financial and business specialists, so you can realise your potential, powered by numbers.
Frequently asked questions
What does the ASX quilt chart actually show?
It ranks regional sharemarket returns from highest to lowest each year, with a separate tile representing a diversified portfolio. The point is to make leadership rotation visible, and to show that a diversified portfolio sits steadily in the middle while individual regions move around.
Why do sharemarket winners rotate?
Different regions are exposed to different drivers (currency, commodities, sector mix, valuations, monetary policy). When those drivers change, leadership changes. Trying to forecast the rotation in advance is hard, which is why diversification is the default for long-term investors.
How often does the sharemarket have a negative year?
On average, roughly every 4 to 5 years over long historical periods. Negative years are not rare events, they are part of the long-term return pattern. Avoiding them entirely would also avoid the recoveries that drive most of the long-run gain.
Should Australian investors own international shares?
Most diversified portfolios include a meaningful international allocation. The Australian market is concentrated in financials and resources, so global exposure adds sector diversification (especially technology, healthcare, and consumer) and reduces single-country risk.
Is the US sharemarket too concentrated to invest in?
The US has been the headline winner for years, with a large chunk driven by technology. The honest answer is that nobody knows the short term. That is precisely why diversification matters. It lets you participate without pretending you can forecast perfectly.
Why does Japan still get attention even after a strong run?
Even after meaningful gains, Japan has often been one of the cheaper developed markets compared to the US. Value can exist after a good run, depending on what earnings and valuations are doing underneath. Leadership changes, and ‘cheap’ and ‘expensive’ matter over time.
Ready to talk?
If you would like a calm, no-pressure conversation about whether your portfolio is built to endure the next 10 years, we would be glad to set one up.
Please feel free to get in touch on 1300 925 081 or send an email to [email protected] if you’d like to book in a chat on the above or on other matters.
Disclaimer
This article contains general information only and has been prepared without considering your objectives, financial situation or needs. It is not personal financial advice, taxation advice or legal advice and should not be relied upon when making financial decisions. Before acting on any information, consider its appropriateness to your circumstances and seek professional advice where appropriate.