
Table of Contents
Geopolitical and military conflict has rattled Australian and global share markets repeatedly since WW2. Each new crisis feels different in the moment. The historical pattern of investor responses has been remarkably consistent across very different conflicts.
Below is a 2026 lens, drawing on the consistent historical evidence and a framework from Shane Oliver (AMP Capital economist) for thinking about how the current event might unfold.
Not all conflicts move markets the same way
An important caveat upfront. Not all military conflicts have meaningful financial market impact.
Afghanistan (2001-2021) had relatively limited equity market impact globally. Sustained, but not headline-driving.
Iraq War 1 (1990-1991) and Iraq War 2 (2003) were materially different because they threatened world oil reserves, generating significant volatility through energy markets.
The takeaway: distance, duration, and the resources at stake all matter. The reflexive answer that ‘every conflict is a market crisis’ is not supported by the historical evidence.
What the historical data tells us
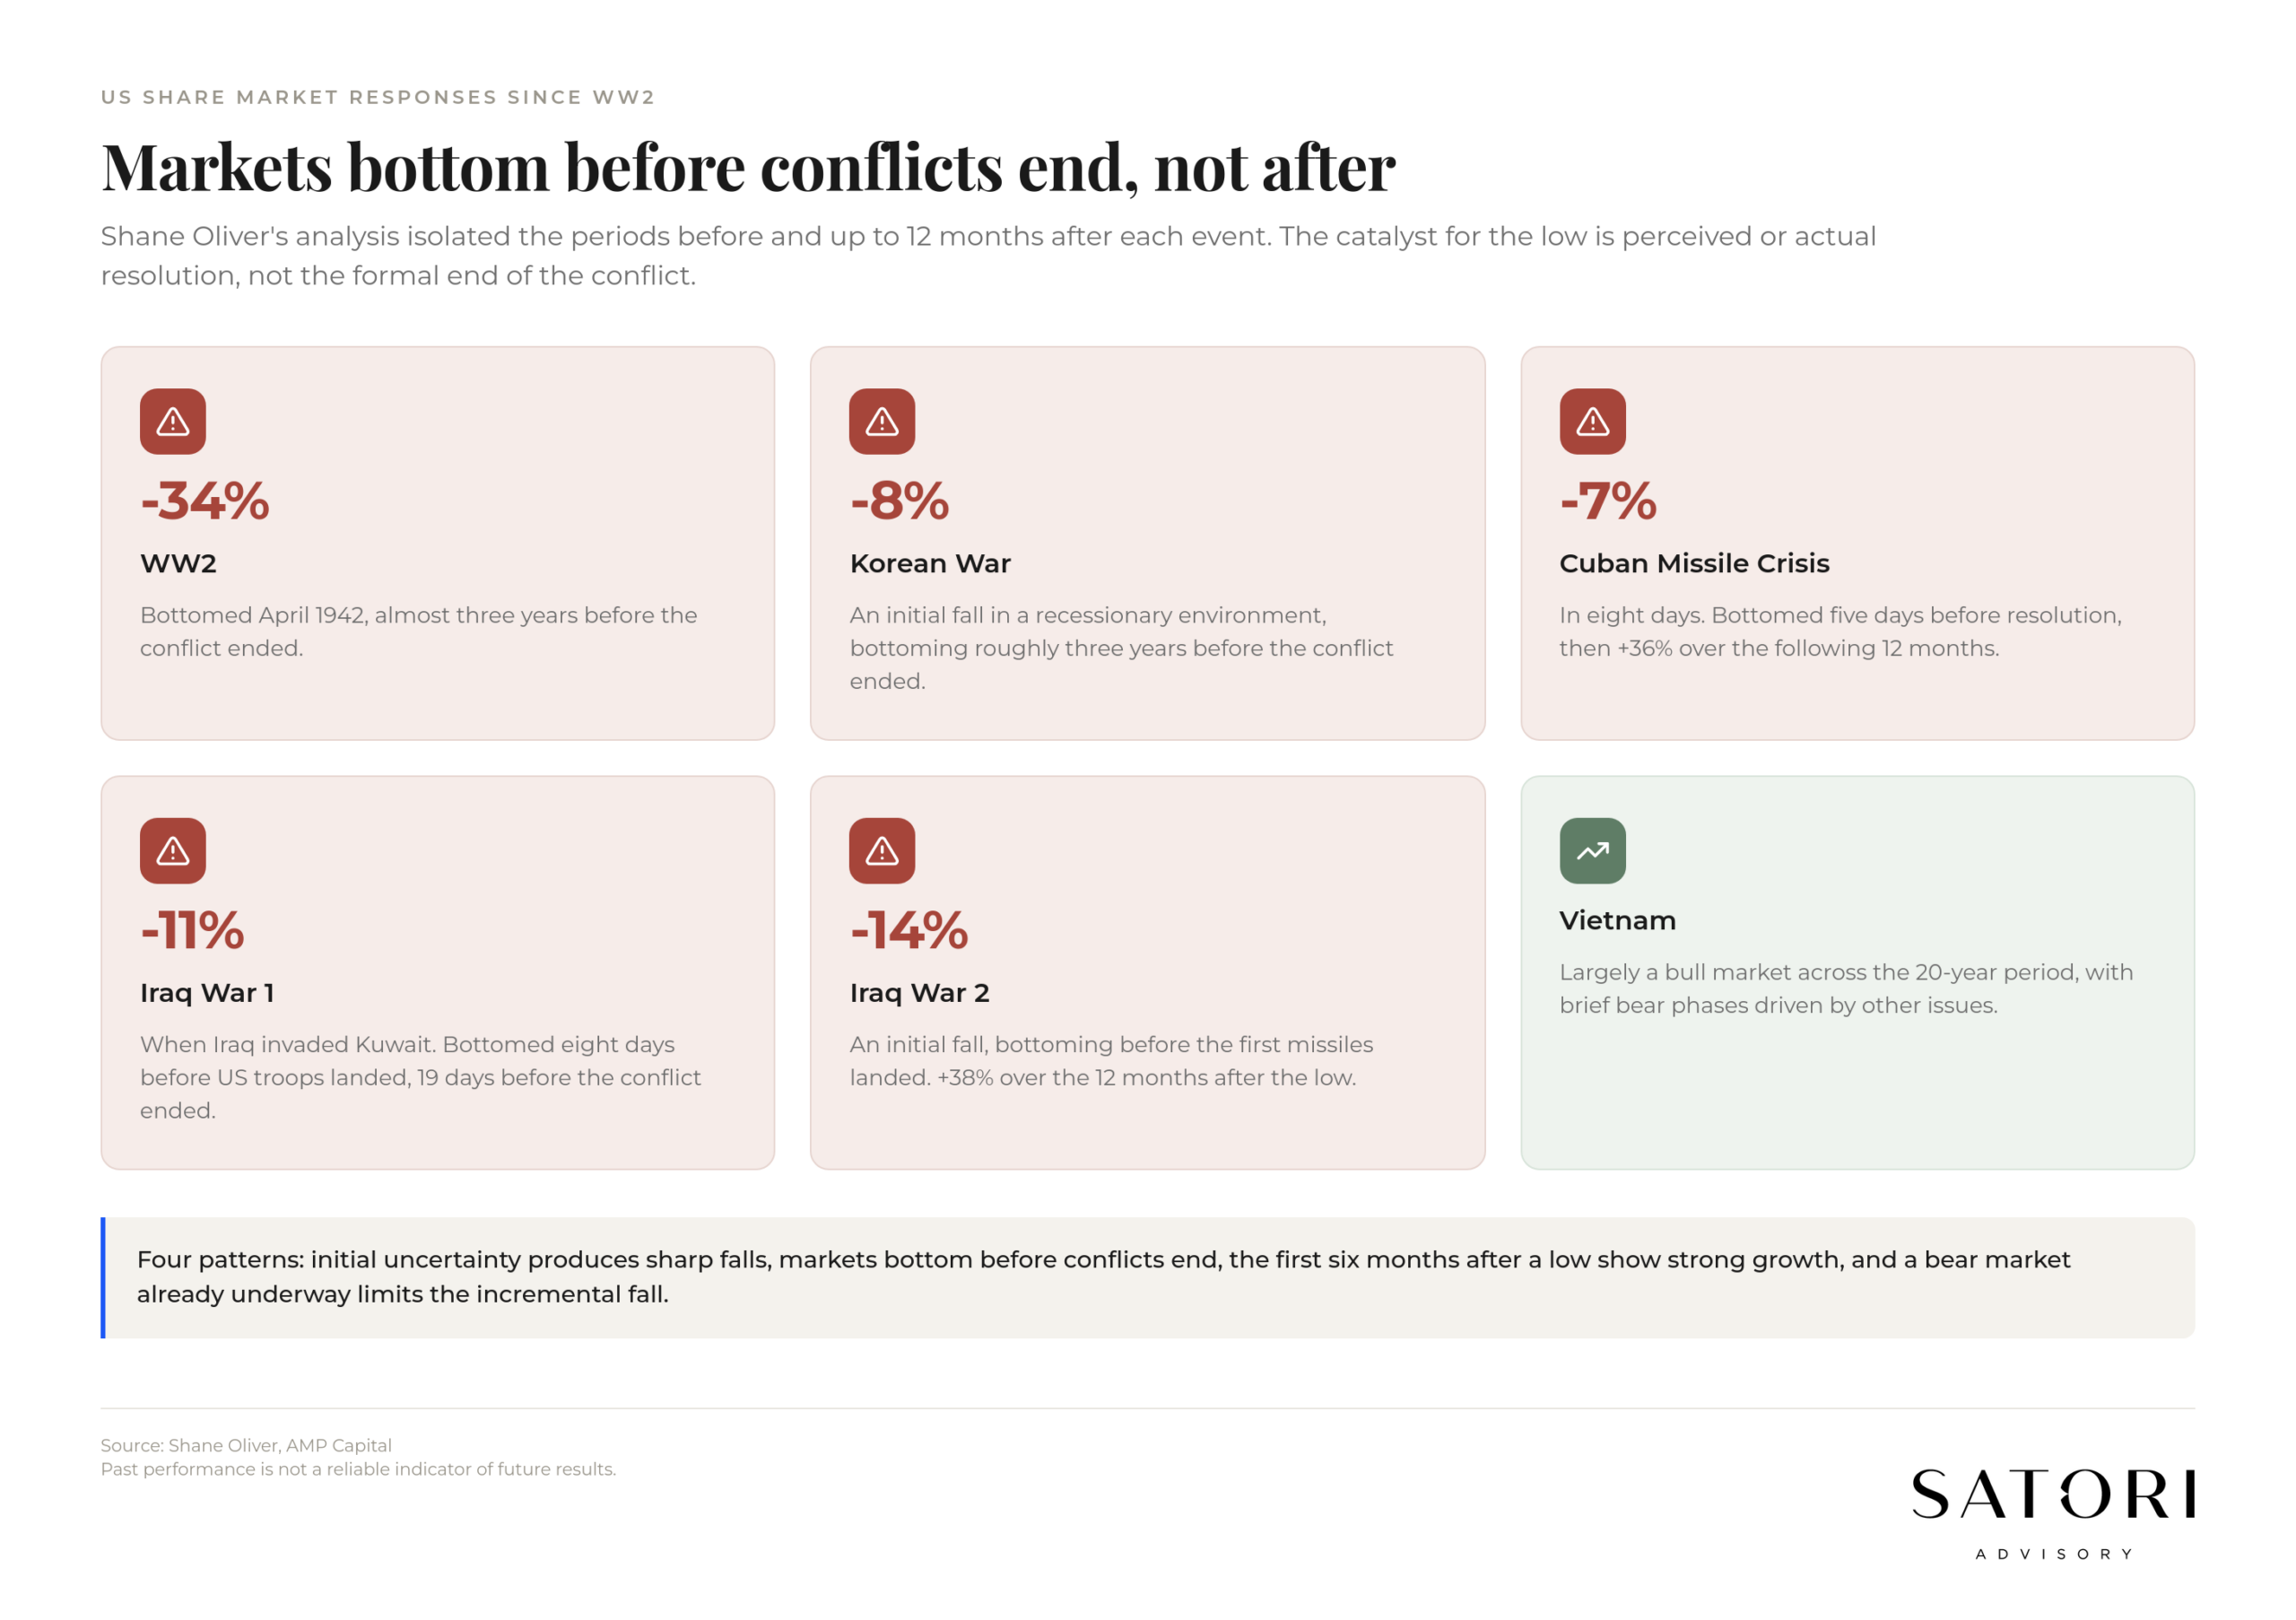
Shane Oliver’s analysis (AMP Capital) of US share market responses to major conflicts isolated periods before and up to 12 months after each event. The conflicts analysed: WW2 (1939-1945), Korean War (1950-1953), Vietnam War (1955-1975), Cuban Missile Crisis (1962), Iraq War 1 (1990-1991), Iraq War 2 (2003).
Five consistent observations.
WW2: shares fell 34% from outbreak, bottomed April 1942 (almost 3 years before the conflict ended). Within 6 months of the low: +25%. Within 12 months: +54%. By the end of the conflict: +108%.
Korean War: shares fell 8% initially in a recessionary environment, bottomed approximately 3 years before the conflict ended, finished +31% 12 months after the low.
Cuban Missile Crisis: shares fell about 7% in 8 days, bottomed 5 days before resolution, +36% 12 months after the low.
Iraq War 1: shares fell 11% when Iraq invaded Kuwait. Bottomed 8 days before US troops landed (19 days before the conflict ended). +34% 12 months after the low.
Iraq War 2: shares fell 14% initially, bottomed before the first missiles landed. +38% 12 months after the low.
Vietnam was largely a bull market through the 20-year period, with brief bear phases driven by other issues. The conflict’s market impact was small.
Four patterns worth holding
From the historical data, four patterns emerge.
Initial uncertainty produces sharp falls. The market drops on the headline before anyone knows the outcome.
Markets bottom BEFORE conflicts end. The catalyst is perceived or actual resolution, not the formal end of the conflict.
The first 6 months after a low show strong growth. Recovery is fast once the market has priced in a path.
Bear markets before the conflict limit the falls. When conditions were already weak, the conflict added a small marginal hit rather than a large new shock.
Shane Oliver’s four scenarios for any current event
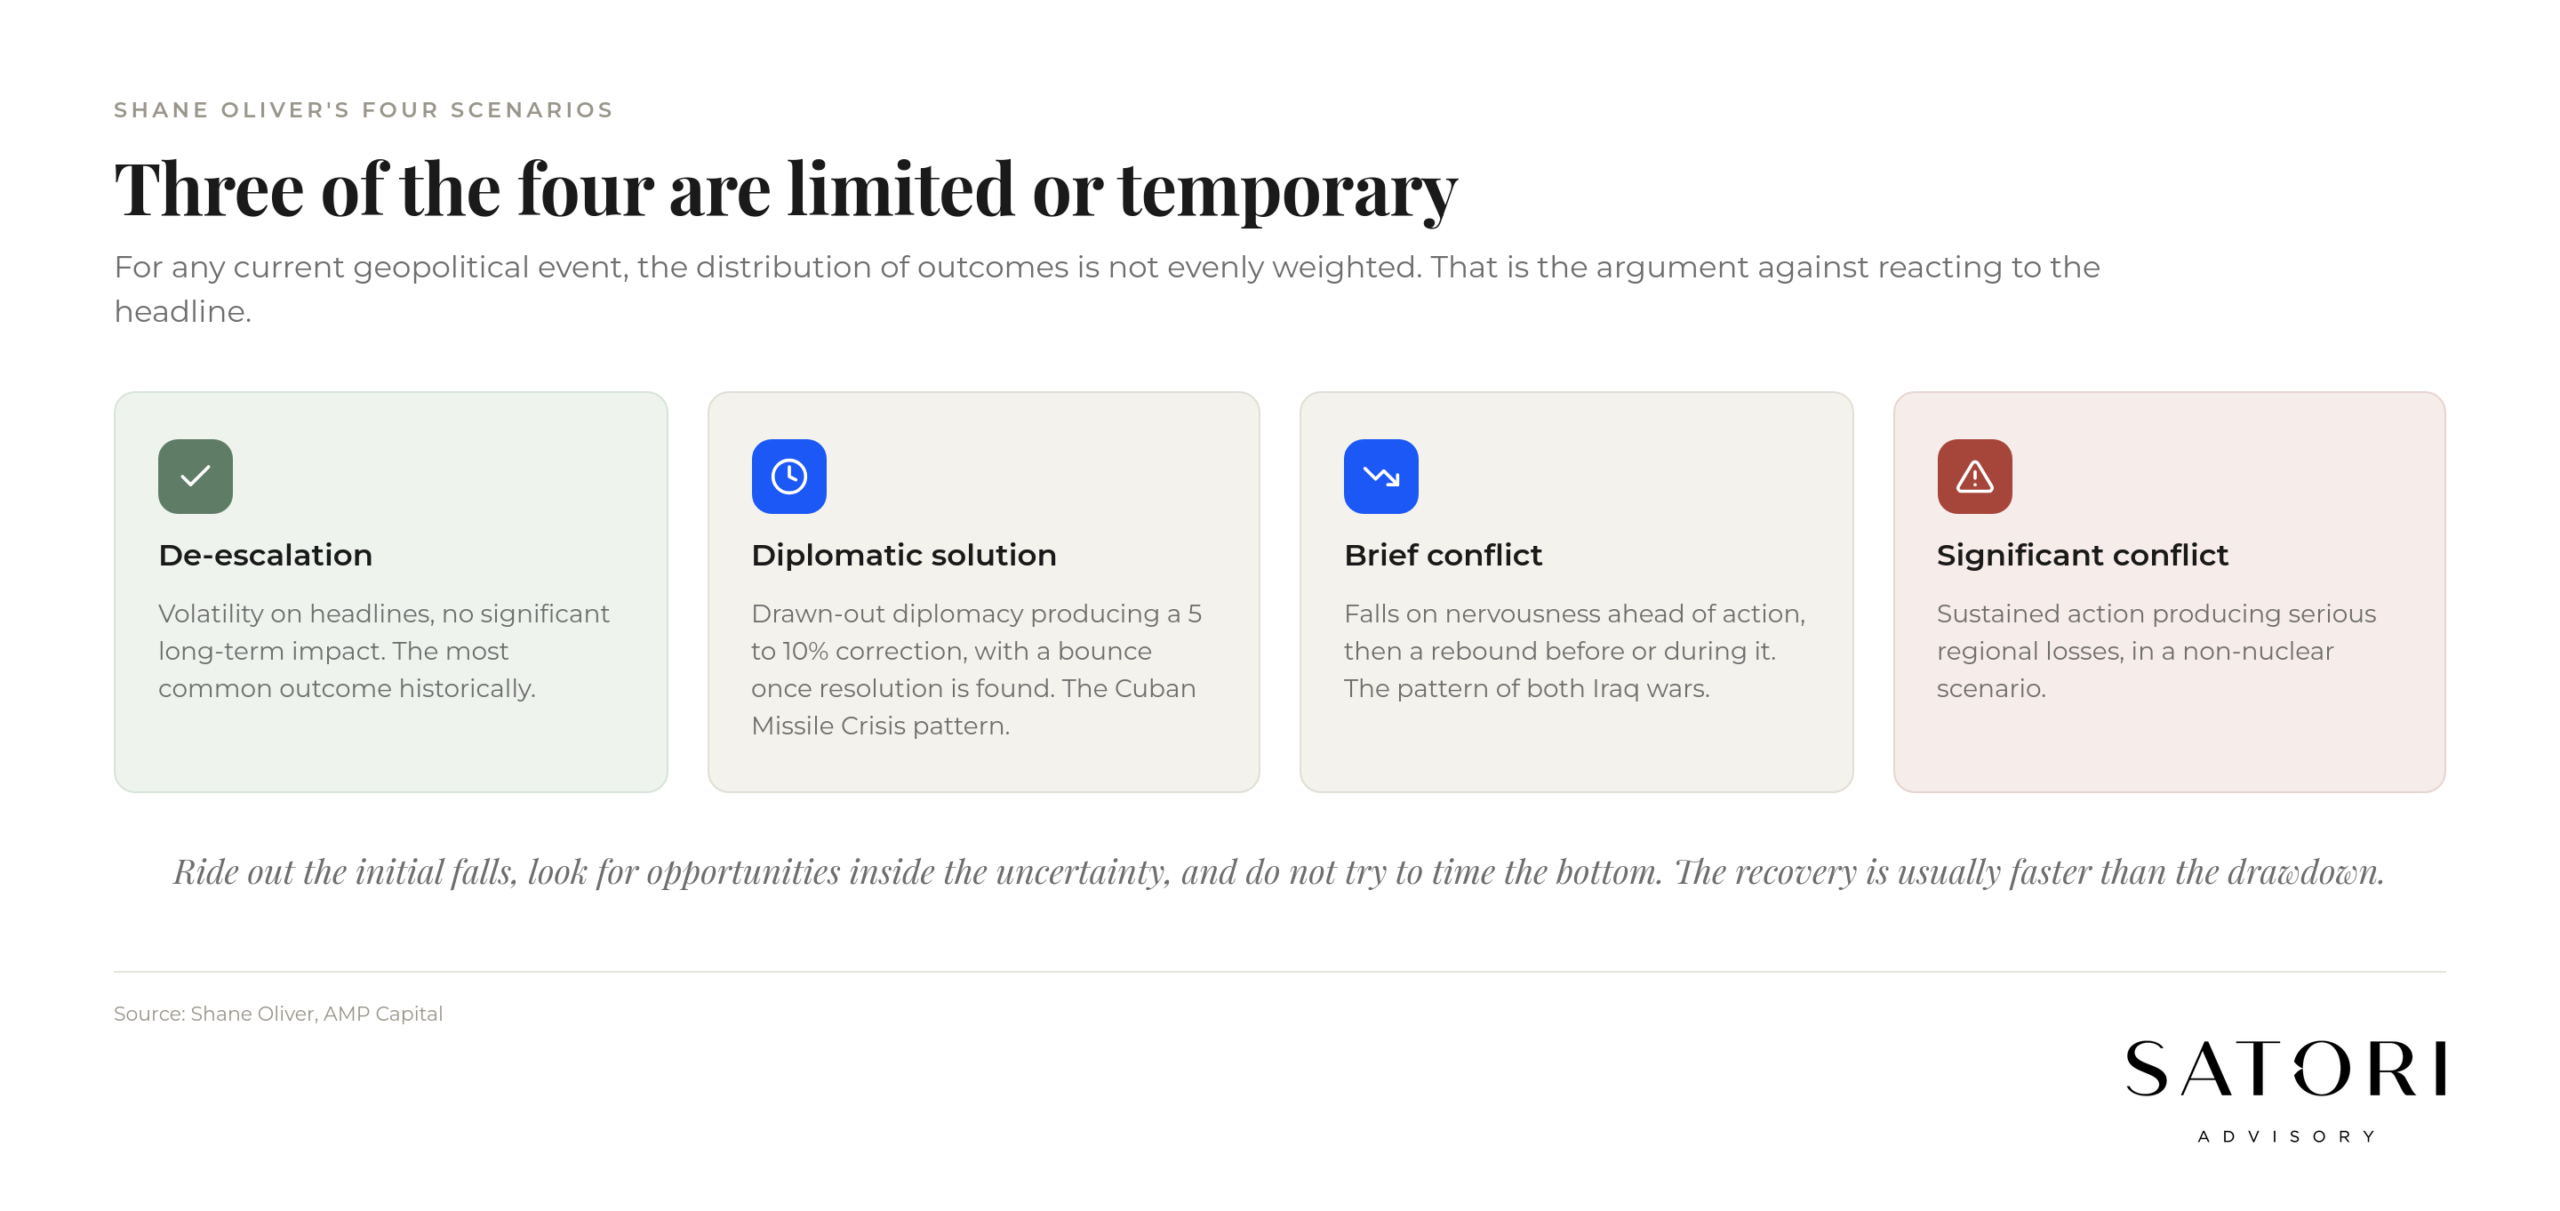
Four ways a current geopolitical event can unfold for markets.
De-escalation. Some volatility on headlines, but no significant long-term market impact. The most common outcome historically.
Diplomatic solution. Drawn-out diplomacy producing a 5-10% market correction with a bounce once resolution is found. The Cuban Missile Crisis fits this template.
Brief conflict. Falls based on nervousness ahead of military action, then a rebound before or during the actual action. The two Iraq Wars fit this template.
Significant military conflict. Assuming a non-nuclear scenario, sustained action produces serious regional losses (South Korea and Japan in a Korean Peninsula scenario; relevant European markets in a European scenario), with global markets falling approximately 20%.
The implication: for any current geopolitical event, three of the four scenarios are limited or temporary in their market impact. Only the fourth produces sustained large drawdowns. Position your portfolio for the range, not for the worst case.
What disciplined investors actually do
Three behaviours that the historical data supports.
Ride out the initial falls caused by uncertainty and nervousness. The market low often arrives well before the resolution, and selling into the panic usually means missing the recovery.
Look for opportunities hidden within the uncertainty. Some sectors and geographies benefit from any given crisis (currencies, manufacturing, technology, logistics in a trade-related shock; defence and cybersecurity in a security shock).
Do not try to time the bottom. The recovery is usually faster than the drawdown, and the cost of being out of the market across the bottom is greater than the cost of being in during the fall.
Two behaviours to avoid.
Panic-selling broad equity exposure to cash on the basis of headlines.
Concentrating into ‘safe haven’ assets (often gold, sometimes specific defensive sectors) based on the assumption that the worst-case scenario will unfold.
How portfolio construction handles geopolitical risk
A diversified Australian portfolio in 2026 absorbs geopolitical shocks without requiring tactical changes. The relevant features:
International equities (US, Europe, Asia ex-China, emerging markets) spread the geographic risk so no single regional conflict dominates the result.
Australian equities with broad sector exposure (not concentrated in any single industry).
Infrastructure and listed property as volatility dampeners.
Fixed interest as a stabiliser in a flight-to-quality.
Cash as optionality.
A portfolio matched to the investor’s time horizon and risk tolerance will experience geopolitical events as bumps along a longer track, not as existential threats.
How Satori thinks about geopolitical risk
We treat geopolitical risk as a feature of the investment environment rather than an event to time. Asset allocation is set in advance to absorb the kinds of shocks history shows are real, without making big tactical moves on individual headlines.
When clients call during a geopolitical crisis, the conversation is usually about confirming the plan is still right rather than changing it. In most cases the right answer is no change.
What to do next
Check your asset allocation against your real time horizons. Money you need in 0-3 years should not be in growth assets, regardless of geopolitical events.
Confirm your regular contributions are still running through any volatile period.
Resist the temptation to make tactical changes based on a single headline.
Talk to your adviser if the headlines are making you reconsider the long-term plan. The right answer is usually no change.
How Satori Advisory works
At Satori Advisory we integrate your tax, business, wealth and lending as a prosperity engine, aligned with what matters most to you. With a clear roadmap, informed by data and backed by decades of strategic experience, we simplify the complex. We don’t offer pre-packaged solutions. We deliver tailored, end-to-end advice that reflects your reality and ambitions. You’ll work directly with senior advisers who listen deeply, think boldly and act with purpose. Feel cared for by our trusted team and curated network of financial and business specialists, as we empower you to make smart decisions and realise your potential, powered by numbers.
Frequently asked questions
How do military conflicts affect the share market?
Historically, initial uncertainty produces sharp falls (7-34% across major events). Markets typically bottom BEFORE conflicts end. Recovery from the market low is consistent: 25-54% within 12 months of the low across WW2, Korea, Cuban Missile Crisis, Iraq I, and Iraq II per Shane Oliver’s analysis.
Should I sell to cash during a geopolitical crisis?
Almost always no. The historical evidence is consistent: selling into the panic usually means missing the recovery, which is typically faster than the drawdown. The discipline is to ride out the initial falls and look for opportunities in the uncertainty.
What scenarios should investors prepare for?
Four scenarios. De-escalation (volatility, no major impact). Diplomatic solution (5-10% correction, bounce on resolution). Brief conflict (falls before action, rebound during or after). Significant conflict (sustained ~20% global drawdown assuming non-nuclear). Position for the range, not just the worst case.
Do all military conflicts move markets?
No. Distance, duration, and the resources at stake all matter. Afghanistan had limited equity market impact globally. Iraq I and Iraq II were material because they threatened world oil reserves. The reflexive view that every conflict is a market crisis is not supported by history.
How did Australian shares perform during major historical conflicts?
Shane Oliver’s analysis focused on the US market. Australian shares historically correlate strongly with global equities, so the patterns are broadly similar with timing differences and additional commodity-related effects. Diversified Australian portfolios that held through major conflicts ended the periods in roughly the position they would have been in absent the conflict.
Where can I find opportunities during a crisis?
Sectors that benefit from any given crisis vary by the crisis. Trade-related shocks often benefit currencies, manufacturing, technology, and logistics. Security-related shocks often benefit defence and cybersecurity. The best position is broad diversification that benefits across multiple scenarios.
Ready to talk?
If you would like a calm, no-pressure conversation about how this applies to your specific situation, we are here to help.
Please feel free to get in touch on 1300 925 081 or send an email to [email protected] if you’d like to book in a chat on the above or on other matters.
Disclaimer
This article contains general information only and has been prepared without considering your objectives, financial situation or needs. It is not personal financial advice, taxation advice or legal advice and should not be relied upon when making financial decisions. Before acting on any information, consider its appropriateness to your circumstances and seek professional advice where appropriate.