
Table of Contents
Andy Rachleff has held two jobs that most people would consider career peaks. He co-founded Benchmark Capital, the venture firm behind early bets like eBay and Uber. He then founded Wealthfront, one of the first robo-advisers in the United States, built around the idea that good investing should be cheap, automated, and quietly disciplined. He also coined the term ‘product market fit’. When someone with that resume sits down with Kevin Rose for a long conversation about how everyday investors should actually behave, it is worth listening carefully.
Rachleff’s framework is short, deeply researched, and almost boringly consistent with what good Australian advice has been saying for decades. The point of this piece is not to relay celebrity opinions. The point is that the same principles that built Wealthfront in California are the principles that quietly compound for Australian families who get on with their lives instead of trading their portfolios. Below is the translation, with the parts that matter most for AU investors pulled out and made practical.
Diversified, low-cost, low-tax: the three things that actually move outcomes
Rachleff’s first move is to draw a line under what is worth thinking about. He puts it bluntly: you cannot time the market, so do not try. Focus on three things instead.
- Diversification across asset classes and within each asset class.
- Minimising investment fees, which compound against you if you let them.
- Minimising taxes, which is the silent third lever almost no one optimises.
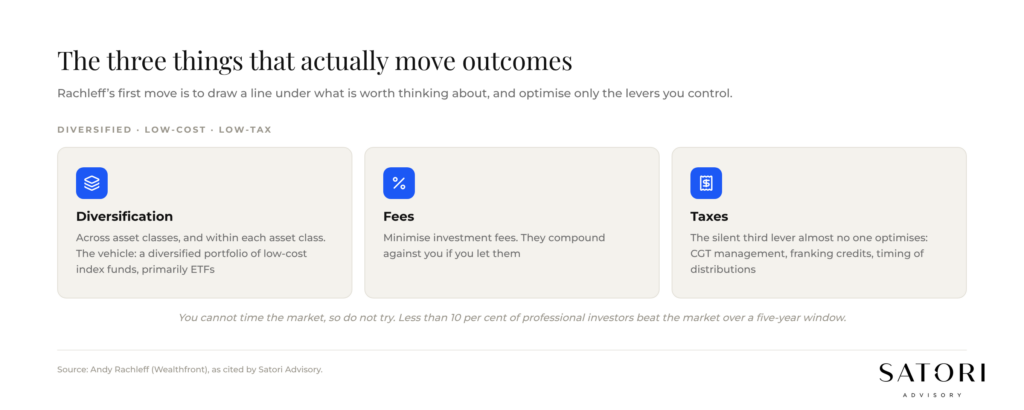
The vehicle he points to for the first leg is a diversified portfolio of index funds, primarily ETFs. The academic research, in his words, is incredibly consistent on this point. The reason is straightforward. Less than 10 per cent of professional investors beat the market over any five-year window, despite doing it every single day for a living. If full-time professionals struggle to beat a passive benchmark, the realistic expected value for a part-time investor picking individual stocks is not better than that, it is worse.
Direct share trading, in Rachleff’s framing, is a terrible idea for the same reason. The illusion of skill tends to appear during fast-rising markets, where everyone makes money and a day-trading breakout follows. The honest question to ask in those windows is not ‘did I make money’, it is ‘how did I do relative to the index, and is my edge sustainable’. The vast majority of the time the answer is ‘no’.
For an Australian context, the same logic is why low-cost, broad-market ETFs across Australian equities, international equities, and fixed income remain the workhorse of most genuinely diversified portfolios. Capital gains tax management, franking credits, and the timing of distributions then quietly do the rest of the work.
Capacity vs tolerance for risk
One of the most useful distinctions Rachleff makes is between capacity for risk and tolerance for risk. They sound similar. They are not.
- Capacity for risk is objective. It is what your balance sheet, income, time horizon and obligations actually allow you to absorb without breaking the plan.
- Tolerance for risk is subjective. It is how much volatility you can sit with emotionally before you start changing your behaviour.
As Rachleff puts it, academics agree that the only thing that really matters in the composition of your portfolio is your tolerance for risk. The catch is that most people do not know how to determine it, and most people overstate it. They feel comfortable saying they are aggressive in a calm market, then feel something very different when the same portfolio is down 20 per cent on a Tuesday afternoon.
If you are likely to retire with more money than you need, you have additional capacity to take risk. If the opposite applies, you do not, regardless of how brave you feel. A common, expensive pattern is the investor with low capacity but high stated tolerance who ‘has a go’ in the wrong asset class and crystallises a loss they cannot earn back in time.
The practical move for Australian investors is to keep these two questions separate. First, run the cash flow and capital model and see what level of risk your plan can actually afford. Then, sit with the volatility profile of that allocation and check whether you can hold it through a difficult quarter. The right portfolio is the one where capacity and tolerance line up. Where they do not, the plan needs to flex, not the personality.
Why dollar cost averaging beats trying to time
History, in Rachleff’s words, has shown that people do not time the market well. They buy when the market is up and sell when it is down. They buy tech when tech is up. The drag from this behaviour is not small. He estimates it can cost between 1 and 3 per cent per year, which compounds into a meaningfully different retirement outcome over twenty years.
His preferred answer, supported by the data, is dollar cost averaging. The mechanic is simple. Invest the same amount of money at regular intervals, regardless of where the market sits on any given day.
- In a rising market, you keep buying and your average cost rises with the trend.
- In a falling market, the same fixed contribution buys more units, lowering your average entry price.
- Across a full cycle, you remove the single biggest behavioural error: waiting for a ‘good moment’ that never comes.
Dollar cost averaging is also where good investing tends to feel wrong. As Rachleff notes, nothing about good investment really feels right in the moment. The right thing to do is often to keep buying when other people are selling and the market is down. Being a contrarian is uncomfortable. Automating the contribution is the kindest thing you can do for your future self, because it removes the moment of decision and lets the strategy keep running.
For Australian investors this often shows up as a regular monthly contribution into an ETF portfolio, an additional concessional contribution into superannuation, or a planned transfer from business cash flow into a long-term investment account. The exact wrapper matters less than the cadence.
What counts as an ‘investment’? Cash flow vs speculation
Rachleff draws a sharp line between investments and speculations. The line is cash flow.
In his words, for an asset to be an investment it needs to have a cash flow. Equities pay dividends. Bonds pay coupons. Property pays rent. Businesses generate earnings. The value of these assets can ultimately be estimated, however imperfectly, from the cash they are expected to throw off.
Crypto, in this framing, is genuinely interesting as a way to facilitate transactions, but it does not produce a cash flow, so it is a speculation rather than an investment. Gold sits in the same bucket. Its value, he argues, is purely emotional. Sophisticated investors he respects do not own these as core investments. He notes that university endowment funds, often considered some of the more disciplined long-term capital pools, do not own gold for this reason.
This is not a moral judgement. By all means, he says, hold a small position for fun if it suits you. But know that you are gambling, not investing, and size the position accordingly. Warren Buffett has made a similar point for years from a different angle: the only thing gold does is sit there and look at you. The Rachleff version is more useful, because it gives you a clear test you can apply to anything that lands in your inbox: does this asset produce a cash flow?
How long do markets actually take to recover?
One of the most calming pieces of data in the conversation is the recovery profile of past corrections. The numbers people imagine in their head are almost always longer and worse than what the historical record actually shows.
- Average time to recover from a market correction (market down 10 per cent) is 4 months.
- Average time to recover from a 20 per cent drawdown is 18 months.
Most investors guess years for both. The gap between perception and reality is exactly where panic-selling happens. If you believe the recovery will take five years, selling at a 20 per cent loss feels almost responsible. If you know the historical average is closer to a year and a half, the same decision suddenly looks like locking in a loss right before the rebound.
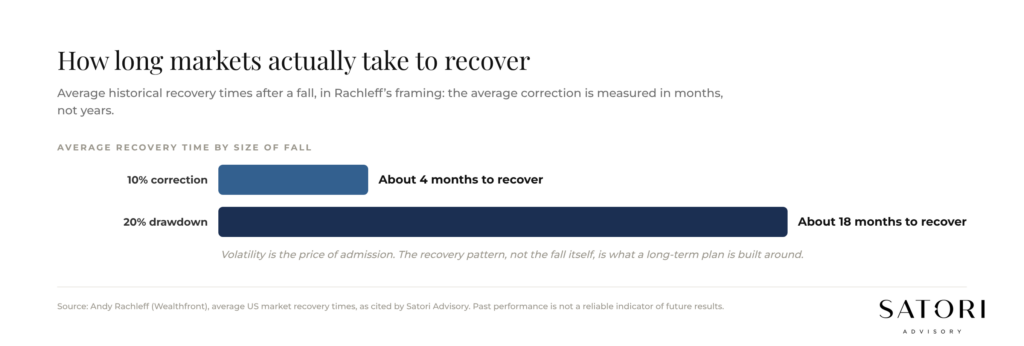
None of this is a guarantee. Averages are averages, and any given event can recover faster or slower. But the anchor matters. When a Tuesday headline is screaming about a 10 per cent fall, the question to hold in your head is not ‘should I do something dramatic’. It is ‘do I still have the capacity and the tolerance to hold this position for the four months it has historically taken to repair’. In most cases the answer is yes, which makes the better action no action.
For Australian investors with super balances, business equity, and property exposures all moving together in a correction, the anchor is even more useful. The instinct to ‘just sell something’ is almost always more expensive than the patience to let the recovery do its work.
The Australian translation: what this means for AU portfolios
Rachleff is talking to a US audience, but the principles port across cleanly. A few translation notes for AU investors who want to act on this rather than just nod at it:
- The ‘diversified ETF portfolio’ lever shows up here as broad ASX, international developed, and emerging market ETFs, balanced with fixed income and a sensible cash buffer, often held inside super for tax efficiency.
- The ‘minimise fees’ lever shows up as choosing low-cost index ETFs over high-fee active funds, and reviewing platform and adviser fees with the same scrutiny as fund fees.
- The ‘minimise taxes’ lever shows up as franking credits, capital gains tax timing, the tax shelter inside super, and the structures that sit around family businesses and trusts.
- The ‘capacity vs tolerance’ lever shows up as honest cash flow modelling, not a 5-question online quiz.
The shape is familiar because it works. The work is in the discipline, not the cleverness.
What to do next
If anything in Rachleff’s framework felt familiar, the next step is not to overhaul anything. It is to ask three quiet questions about your current portfolio.
- Is your portfolio actually diversified, low-fee and tax-aware, or only one or two of those?
- Do your risk capacity and your risk tolerance actually agree, or have you been quietly leaning on bravery to cover a gap?
- If the market fell 20 per cent next quarter, do you have a written plan that already tells you what to do, or are you planning to decide in the moment?
How Satori Advisory works
At Satori Advisory we energise every part of your financial world. We integrate your tax, business, wealth and lending as a prosperity engine, aligned with what matters most to you. With a clear roadmap, informed by data and backed by decades of strategic experience, we simplify the complex. We do not offer pre-packaged solutions. We deliver tailored, end-to-end advice that reflects your reality and ambitions. You work directly with senior advisers who listen deeply, think boldly and act with purpose, supported by our trusted team and curated network of financial and business specialists, so you can realise your potential, powered by numbers.