
Table of Contents
Property is the asset class most Australians know best and yet read most narrowly. The headline number (median price up or down) does most of the talking, and the structural signals underneath it usually do most of the work.
This piece does two things. It lays out a reusable framework for reading an Australian property market update, and then walks through the Feb 2021 update we shared after a conversation with Simon Harris and Lynton Stevenson at Providence Property Group. The dated numbers are not the point. The lens you use to read them is.
How to read an Australian property market update
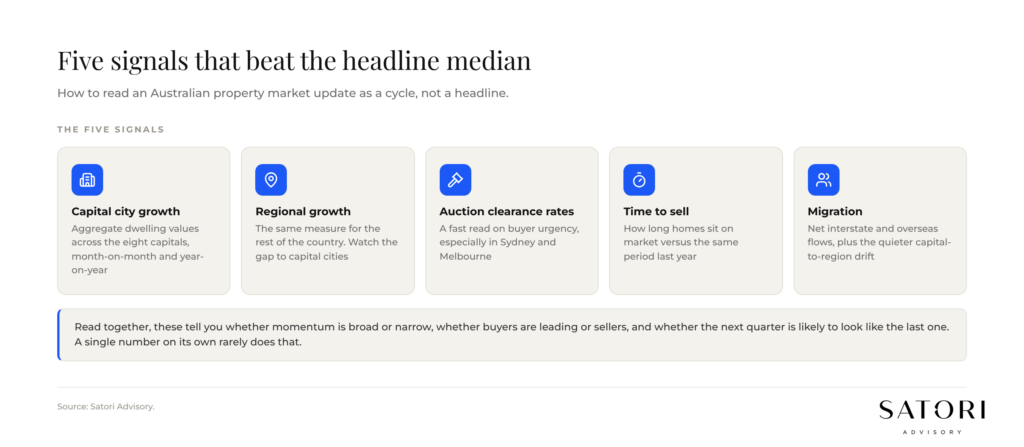
Five signals consistently carry more information than the headline median:
- Capital city growth: aggregate dwelling values across the eight capitals, usually month-on-month and year-on-year.
- Regional growth: the same measure for the rest of the country. Watch the gap to capital cities.
- Auction clearance rates: a fast read on buyer urgency, especially in Sydney and Melbourne.
- Time to sell: how long homes are sitting on market versus the same period last year.
- Migration: net interstate and overseas flows, plus the quieter capital-to-region drift.
Read together, these tell you whether momentum is broad or narrow, whether buyers are leading or sellers, and whether the next quarter is likely to look like the last one. A single number on its own rarely does that.
Case study: the Feb 2021 update
In late February 2021 we shared what we were hearing from CBA’s economists and from Providence Property Group, with Simon Harris and Lynton Stevenson walking us through their view on the ground.
CBA economists were calling the market ‘on the cusp of a boom’. Their forecast was for dwelling prices to rise around 8% in 2021 and a further 6% in 2022. House prices were expected to lift around 16% and units around 9% across the two years combined. Translated into city medians, that pointed to Sydney near $1.2 million and Melbourne near $920,000.
Our own view was more measured. We were not perma-bull on property at any point in the cycle. The case for strong growth over the next three to four years was based on cycle research, not on a single forecast. That distinction matters more than the number itself.
Capital city versus regional dispersion
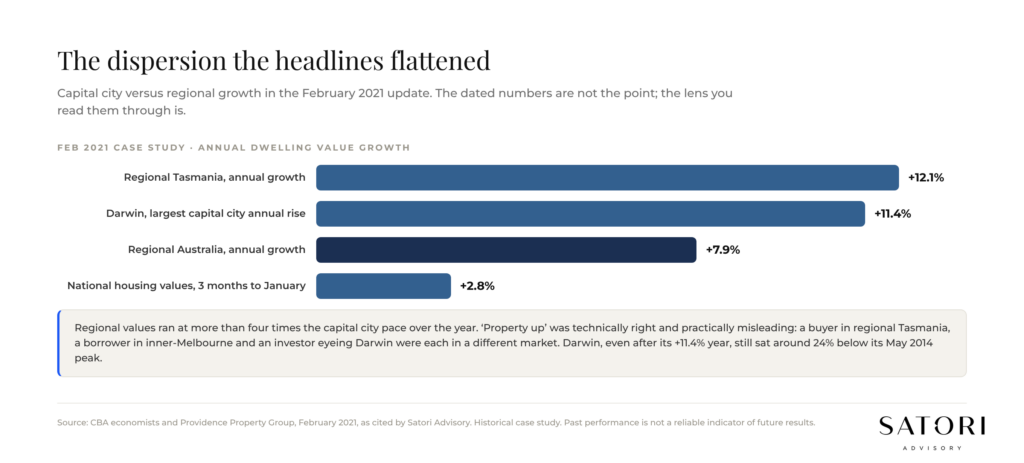
- Housing values lifted around 2.8% in the three months to January.
- Regional values were up 7.9% over the year, more than four times the capital city pace.
- Darwin posted the largest annual capital city rise at +11.4%, while still sitting around 24% below its May 2014 peak.
- Regional Tasmania was up 12.1% over the year.
That dispersion is the part most headlines flattened. ‘Property up’ was technically right and practically misleading. A buyer in regional Tasmania, a borrower in inner-Melbourne and an investor eyeing Darwin were each in a different market.
Rental dispersion and time on market
- Rental growth split sharply between cities. Darwin was up +11.4% over the year, Melbourne was down 2.9%.
- Average time to sell was down by around a week year on year, with strong auction clearance rates reinforcing buyer urgency.
These are useful early-warning indicators. When time to sell falls and clearance rates rise together, buyer competition is tightening before the median catches up.
Migration
- Record regional migration was reported in the September 2020 quarter.
Migration is the slowest of the signals to register, and one of the most important. When people physically move, demand follows them, and the regions that absorb them tend to see price and rent growth that lasts beyond the news cycle.
What this means for buyers and borrowers today
The exact numbers above are from Feb 2021 and should not be read as a current call. The framework, however, holds. When you next read an Australian property market update, walk it through the five signals before forming a view:
- What is the capital city / regional dispersion telling you about where momentum sits?
- Are auction clearance rates and time to sell pointing in the same direction or contradicting each other?
- Where is migration flowing, and is that demand already priced in?
- How does your borrowing capacity and serviceability test against the cycle, not just today’s rate?
- How does this property decision interact with your wealth, tax and lending structure as a whole?
The last question is the one most readers skip. A property purchase is not a stand-alone decision. It sits inside a structure: ownership, gearing, offset, trust and entity layers, super contribution capacity, and timing against income. The price is one variable. The structure is most of the result.
Our cycle view, in plain language
We are not in the business of calling tops and bottoms. Over a long horizon, Australian residential property has rewarded patient borrowers with well-structured debt and a strong cash flow plan, and punished impatient ones with the wrong structure for their stage of life.
The cycle is real, the local dispersion is large, and the structure around the purchase matters more than the headline rate. Read the five signals together, decide where this purchase fits in your broader plan, and let the cycle do its work.
How Satori Advisory works
At Satori Advisory we energise every part of your financial world. We integrate your tax, business, wealth and lending as a prosperity engine, aligned with what matters most to you. With a clear roadmap, informed by data and backed by decades of strategic experience, we simplify the complex. We do not offer pre-packaged solutions. We deliver tailored, end-to-end advice that reflects your reality and ambitions. You work directly with senior advisers who listen deeply, think boldly and act with purpose, supported by our trusted team and curated network of financial and business specialists, so you can realise your potential, powered by numbers.
Frequently asked questions
What is an Australian property market update?
It is a regular read on the state of residential property across capital cities and regions, combining price growth, auction clearance rates, time to sell and migration flows. A useful update reads these signals together rather than relying on a single median number.
Why do capital cities and regions move differently?
Capital cities and regions respond to different drivers: cities lean on employment, immigration and credit, while regions lean on internal migration, lifestyle moves and infrastructure. In the Feb 2021 update we shared, regional values were up 7.9% year on year while capital city growth was much lower.
What were CBA economists forecasting in Feb 2021?
CBA economists described the market as ‘on the cusp of a boom’ and forecast dwelling prices to rise around 8% in 2021 and 6% in 2022, with house prices up around 16% and units up around 9% over two years. Those numbers should be read as a historical case study, not a current forecast.
How should a Satori client read these signals today?
As inputs into a structured plan, not as a buy or sell trigger on their own. Your borrowing capacity, serviceability, ownership structure and broader wealth plan are what decide whether the cycle works for you, and we walk through all of that together before any property decision is finalised.
Ready to talk?
If you would like a calm, no-pressure conversation about how an Australian property decision fits into your broader wealth, tax and lending plan, we would be glad to set one up.
Please feel free to get in touch on 1300 925 081 or send an email to [email protected] if you’d like to book in a chat on the above or on other matters.
Disclaimer
This article contains general information only and has been prepared without considering your objectives, financial situation or needs. It is not personal financial advice, taxation advice or legal advice and should not be relied upon when making financial decisions. Before acting on any information, consider its appropriateness to your circumstances and seek professional advice where appropriate.