
Table of Contents
My goal this week is to show you the returns in the Australian equity market. And in turn, for many, to explain what you are seeing in most superannuation fund returns across the industry.
It matters because many Australians hold a large share of their wealth in the Australian share market, often without knowing the sectors and companies that move it the most. If you understand the engine, the headlines make a lot more sense.
The market’s performance
Australian share performance, measured by the ASX 200, was only around 3% over the 12 months to 20 November 2023, the window this piece originally analysed. That was well under the rest of the world. The exact figure is a point-in-time snapshot. What lasts is the structural reason behind it, which the rest of this piece unpacks.
It can be tempting to read that as something going wrong with Australian companies. The more useful reading is that the index is heavily exposed to a few sectors, and those sectors moved differently to the sectors that drove the rest of the world over that window.
Why the ASX 200 is so top-heavy
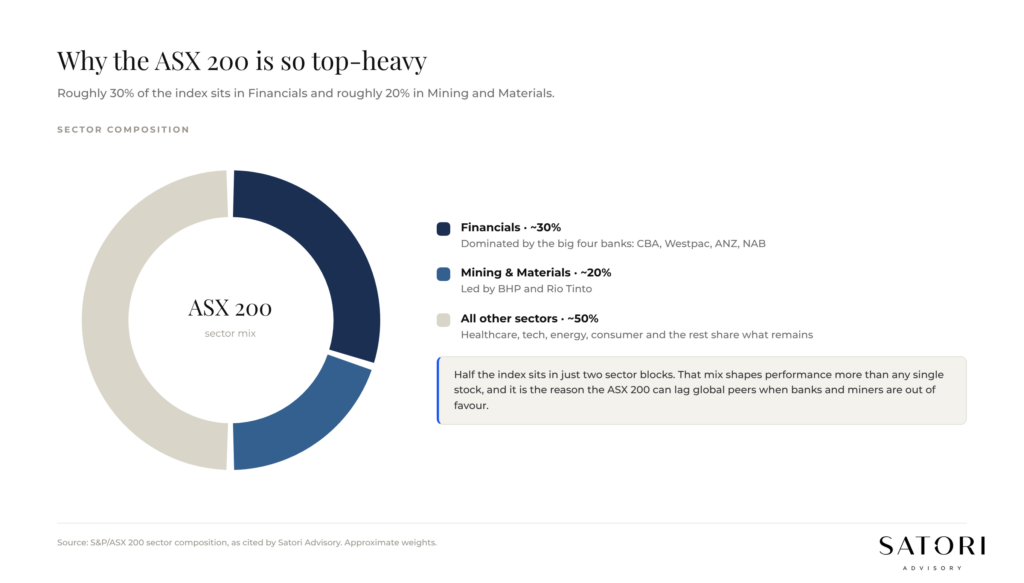
The Australian share market’s composition is strikingly top-heavy. A handful of sectors and companies carry the lion’s share of influence. Two sectors do most of the work.
Financials, around 30% of the index
Leading the pack is the financial sector. Banks and financial institutions are the titans here, with a weighting of around 30%. This is not just a number, it is a measure of how much these institutions move the index.
The big four banks (Commonwealth Bank, Westpac, ANZ and NAB) are more than financial pillars. They are market movers. When the banks have a good year, the ASX 200 usually does too. When margins compress or bad-debt provisions rise, the index feels it quickly.
Mining and Materials, around 20% of the index
Next in line is the mining and materials sector, accounting for approximately 20% of the market. Companies like BHP and Rio Tinto do not just dig up minerals. They materially impact the market’s performance.
Over the 12 months we are looking at, Materials performed well relative to the overall ASX 200. The catch is that even with that relative outperformance, the sector still underperformed major markets like the US, Europe and Japan. Strong relative is not the same as strong absolute.
How Australia stacks up against the rest of the world
Most global indices we compare to have a different sector mix. They often carry larger weightings in technology, consumer discretionary and healthcare, and lower weightings in banks and miners. When growth-led sectors run hard, those markets pull ahead of an index built mainly on banks and resources.
None of that is a value judgement. It is just a structural difference. The ASX 200 was never built to look like the S&P 500. Once you accept that, performance comparisons become less surprising and more useful.
What APRA data tells us about super
Here is extra context on where your peers have their super.
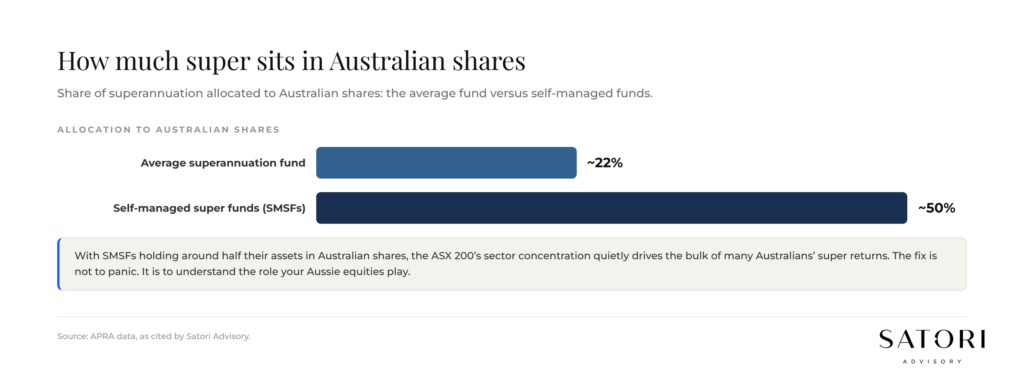
- APRA data shows Australians on average hold around 22% of their super in Australian shares.
- SMSFs on average hold around 50% in Australian shares.
That second number is the one worth pausing on. If you run a self-managed super fund and roughly half of it sits in the ASX, you are heavily exposed to two sectors: Financials and Mining. Whatever those sectors do over the next decade will likely dominate your retirement outcome.
This does not automatically mean the allocation is wrong. Plenty of Australian investors have built long, successful track records with a strong domestic equity bias. The question is whether the exposure is intentional and stress-tested against your goals, or simply inherited.
What to do with this information
This is not an email triggering immediate change. The above is dangerously simplified. We have not begun to talk about interest rates, currency, franking credits, or how Australian shares interact with global equities in a real portfolio.
Even so, three practical takeaways usually fall out of conversations like this.
1. Understand the role of your Aussie equity exposure
Just take stock. Know how much of your wealth sits in Australian shares, across super, SMSFs and personal portfolios. Know which sectors that exposure is concentrated in. Know how your portfolio behaves when banks have a poor year, or when commodity prices fall sharply.
Understanding the role of your Aussie equities sets the foundation for every other decision: how much to invest globally, how much to hold in fixed-interest, how much cash buffer to carry.
2. Do not panic, long game is the easy game
It is just how markets operate. Long game is the easy game. A 12-month window where the ASX 200 returns around 3% is not a verdict on Australian companies, it is one data point in a much longer series.
If your plan was built around a 7 to 10 year horizon, a flat year is uncomfortable but it is not a reason to rip up the plan. Far more wealth has been destroyed by reactive portfolio changes after a slow year than by sticking with a sensible mix through one.
3. Seek advice if you do not have clarity
Seek advice if you do not have clarity on the why, what and how behind your own Australian share market exposure. The right adviser should be able to answer three questions clearly: why you hold what you hold, what role each holding plays, and how the whole mix behaves in different scenarios.
As always, this is general commentary, not personal financial advice. We are just sharing how we read the market.
How Satori Advisory works
At Satori Advisory we energise every part of your financial world. We integrate your tax, business, wealth and lending as a prosperity engine, aligned with what matters most to you. With a clear roadmap, informed by data and backed by decades of strategic experience, we simplify the complex. We do not offer pre-packaged solutions. We deliver tailored, end-to-end advice that reflects your reality and ambitions. You work directly with senior advisers who listen deeply, think boldly and act with purpose, supported by our trusted team and curated network of financial and business specialists, so you can realise your potential, powered by numbers.
Frequently asked questions
Does more money make you happy?
Not in a simple linear way. The better framing is that money reduces misery more than it creates joy. It removes stress, instability, and uncertainty rather than guaranteeing happiness.
What is the difference between happiness and contentment?
Happiness is often pictured as a peak feeling. Contentment is the steady state of having what you need, when you need it, without comparison or fear. Contentment is the better target for most financial planning.
What is the ‘yardstick trap’?
Using money as a measure of status rather than as a tool for autonomy, time, and stability. People in the yardstick trap are often wealthy and still unhappy.
Why does luck matter to my financial plan?
Because the more outsized a success or failure, the more luck likely played a role. Respecting luck means building buffers, avoiding catastrophic leverage, and planning for uncertainty.
What is ‘too much, too soon, too fast’?
A pattern where pushing beyond a natural growth rate breaks the system. In investing, it shows up as too much leverage after a good run. In business, it shows up as scaling before foundations. In life, it shows up as lifestyle inflation.
Is happiness really ‘reality minus expectations’?
It captures something real, but the prescription to ‘expect less’ is not great. Expectations rise with progress. The more useful framing is to be aware of how expectations move and not let them outrun reality permanently.
What does this mean for my financial plan?
The plan should reduce stress and create flexibility, not just chase returns. Buffers, autonomy, time, and stability are the variables that actually move wellbeing.
Ready to talk?
If you would like a calm, no-pressure conversation about your Australian share market exposure, super and overall wealth strategy, we would be glad to set one up.
Please feel free to get in touch on 1300 925 081 or send an email to [email protected] if you’d like to book in a chat on the above or on other matters.
Disclaimer
This article contains general information only and has been prepared without considering your objectives, financial situation or needs. It is not personal financial advice, taxation advice or legal advice and should not be relied upon when making financial decisions. Before acting on any information, consider its appropriateness to your circumstances and seek professional advice where appropriate.