
Table of Contents
Australian investors live inside a tax system that quietly rewards domestic dividends. Franking credits are one of the few structural advantages built into the design of the market, and most of the people who own franked shares cannot describe exactly how the math works. That is a problem, because the gross-up is not a footnote. It changes the after-tax return materially, and it changes how an Australian dividend strategy should actually be built.
This piece is a practical walk through the income side of an Australian portfolio. How franking actually works, why total return matters more than yield, what the ‘dividend trap’ is and how to avoid it, and how the same headline dividend turns into very different net dollars depending on whether the receiver is a pension fund, a super fund, or a top-bracket payer.
How franking credits actually work
A franking credit is a tax credit that an Australian company passes to a shareholder to reflect the company tax it has already paid on the underlying profit. The Australian system is designed to avoid taxing the same dollar of profit twice: once at the company level, and again in the shareholder’s hands.
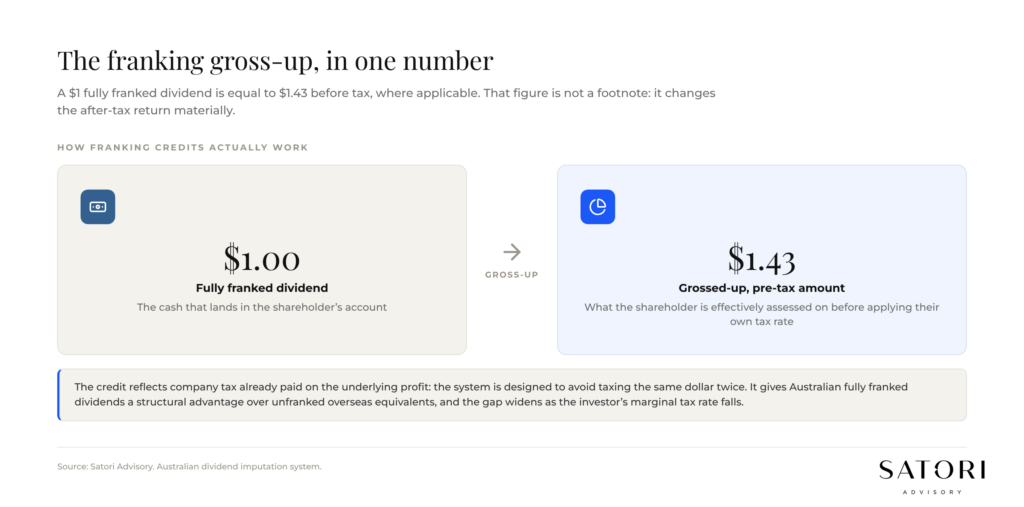
The number to remember is simple. A $1 fully franked dividend is equal to $1.43 before taxes, where applicable. That gross-up assumes the company pays tax at 30 per cent, the rate that applies to most large ASX-listed companies. Base rate entities (turnover under $50 million) pay 25 per cent, which grosses a $1 fully franked dividend up to about $1.33. That 1.43 figure is the ‘grossed-up’ dividend, the amount the shareholder is effectively assessed on before applying their own tax rate.
Because that gross-up is built into the system, Australian fully franked dividends carry a structural advantage over overseas stocks that pay unfranked dividends. The same 4 per cent headline yield does not deliver the same net dollar to an Australian investor depending on whether it is franked or unfranked, and that gap widens as the investor’s marginal tax rate falls.
Two practical implications fall out of that math:
- Comparing an Australian fully franked yield against an unfranked overseas yield as a like-for-like figure is wrong. The franked yield is worth more in your hand, especially in lower tax environments (super, pension, retirees).
- The structure you hold the shares in materially changes the result. The same dividend lands very differently in a SMSF in pension phase versus an individual top-bracket payer.
Yield is not the goal. Total return is.
It is tempting to anchor a portfolio on yield. A 6 per cent yield feels concrete, especially when cash rates are below dividend yields. But yield in isolation is one of the most misleading numbers in investing, for two reasons.
First, the headline yield is sometimes a backward-looking number. It tells you what the company paid last year, not what it can sustainably pay in the next five. The companies that pay the highest current yield often do so because the share price has fallen for a reason, and that reason can apply to the dividend too.
Second, your total return is income plus growth, not income alone. A stock that pays a 6 per cent fully franked dividend but quietly de-rates 4 per cent a year over a decade is not the income engine the yield suggests. A stock that pays a 3 per cent dividend and compounds the capital at 7 per cent is delivering a far stronger total return.
A reasonable framework for Australian income investors is to focus on total return, then choose how to access it. Living off income alone, without ever touching capital, is one valid path. Building a growth-tilted portfolio and taking measured realised capital gains to supplement income is another, and is often the more tax-efficient path for a long retirement.
The dividend trap
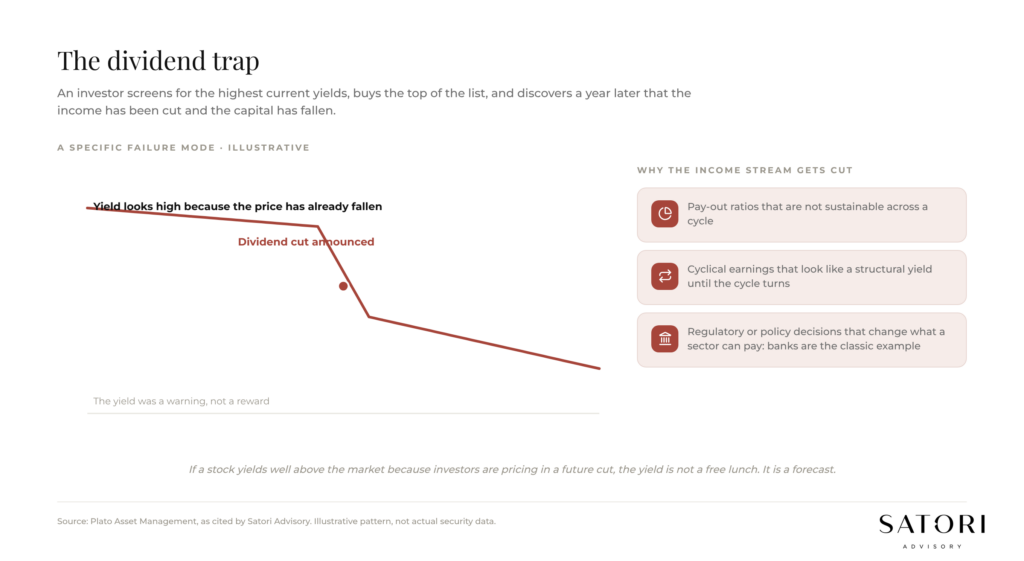
The dividend trap is a specific failure mode. An investor screens for the highest current dividend yields, buys the top of that list, and discovers a year later that the income stream has been cut and the capital has fallen. The yield was a warning, not a reward.
As Plato Asset Management has noted, solely focusing on today’s highest-dividend yielding companies can adversely result in investment losses and lost dividends, when companies later reduce their dividends. The reasons are usually some combination of:
- Pay-out ratios that are not sustainable across a cycle.
- Cyclical earnings that look like a structural yield until the cycle turns.
- Regulatory or policy decisions that change what a sector is allowed to pay (banks are the classic example).
Banks are worth pausing on because they are over-represented in Australian dividend portfolios. APRA has the ability to relax or tighten restrictions on the share of earnings that banks pay out as dividends. When restrictions loosen, dividends can rise. When they tighten, dividends can fall, regardless of how ‘safe’ the underlying business feels. That policy lever is one of the quiet variables in Australian dividend strategy, and it is worth being honest about. The income line is not entirely in the company’s control.
Dodging the dividend trap is less about screening harder and more about understanding why a yield is what it is. If a stock yields well above the market because investors are pricing in a future cut, the yield is not a free lunch. It is a forecast.
Why structure matters: the net-after-tax return chart
The chart that most surprises clients in this part of the conversation is not about yield at all. It is about net-after-tax return by income type, across pension, super and top-bracket payers.
The same $1 of headline income produces very different take-home dollars depending on three things: the type of income (franked dividend, unfranked dividend, short-term capital gain under 12 months, long-term capital gain over 12 months), the rate the receiver pays, and the structure that holds the asset. Three quick reminders are usually enough.
- Pension phase super pays no tax on investment earnings up to the transfer balance cap, and benefits the most from franked dividends and from long-term capital gains.
- Accumulation phase super pays 15 per cent on earnings and gets a one-third discount on long-term capital gains, which is a different shape again.
- Top-bracket individuals pay their marginal rate, with the 50 per cent CGT discount on assets held more than 12 months and the franking gross-up applied to fully franked dividends.
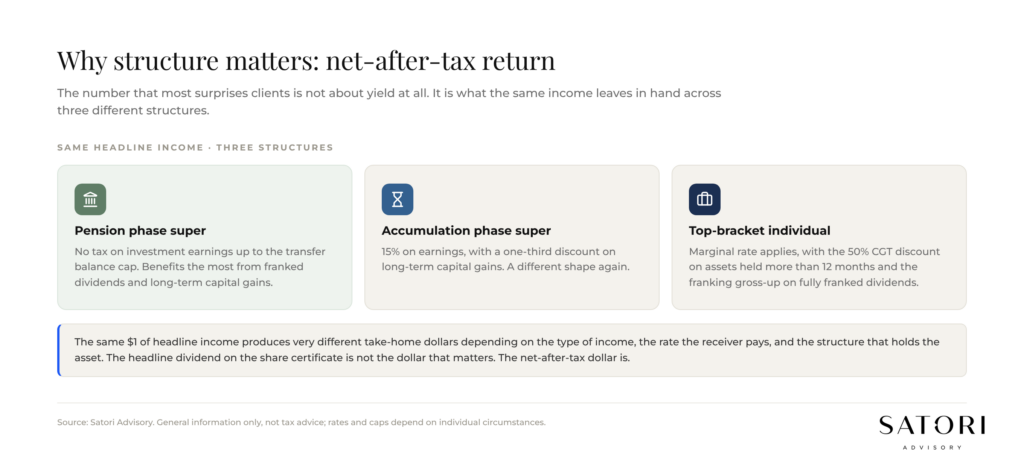
The point is not to memorise the rates. The point is that the headline dividend on the share certificate is not the dollar that matters. The net-after-tax dollar is. And that dollar is a function of structure as much as security selection.
What this means in practice
Three questions are usually enough to test an Australian dividend strategy against this view.
- Are you measuring total return (income plus growth), or just income? If only income, the next decade is likely to disappoint, regardless of how good the headline yield feels today.
- Is your current dividend exposure concentrated in a small number of yield-heavy stocks (often the banks and a few large industrials)? If so, your income depends partly on policy decisions, not just on the underlying businesses.
- What is your actual net-after-tax return by source of income, by structure? If you cannot answer in dollars, the structure may be doing less for you than it could.
If those questions surface anything that does not stack up, please reach out. We can map your real net-after-tax return and compare it to a portfolio engineered for total return rather than headline yield.
How Satori Advisory works
At Satori Advisory we energise every part of your financial world. We integrate your tax, business, wealth and lending as a prosperity engine, aligned with what matters most to you. With a clear roadmap, informed by data and backed by decades of strategic experience, we simplify the complex. We do not offer pre-packaged solutions. We deliver tailored, end-to-end advice that reflects your reality and ambitions. You work directly with senior advisers who listen deeply, think boldly and act with purpose, supported by our trusted team and curated network of financial and business specialists, so you can realise your potential, powered by numbers.