
Table of Contents
Out of the major global sharemarket indices, leadership shifts more than most investors realise. At one point in time, Japan’s TOPIX has led on 12-month returns. The point of noticing this is not to chase whichever region is on top. It is to remember that ‘the market’ is shorthand for many different markets that behave differently in any given year.
What companies actually make up these markets?
It is worth pausing on what is inside the indices we talk about. As one example, looking at the Japanese market by market capitalisation (share price multiplied by number of shares, in USD) reveals that Nintendo has at times been comparable in market cap to one of Australia’s Big Four banks.
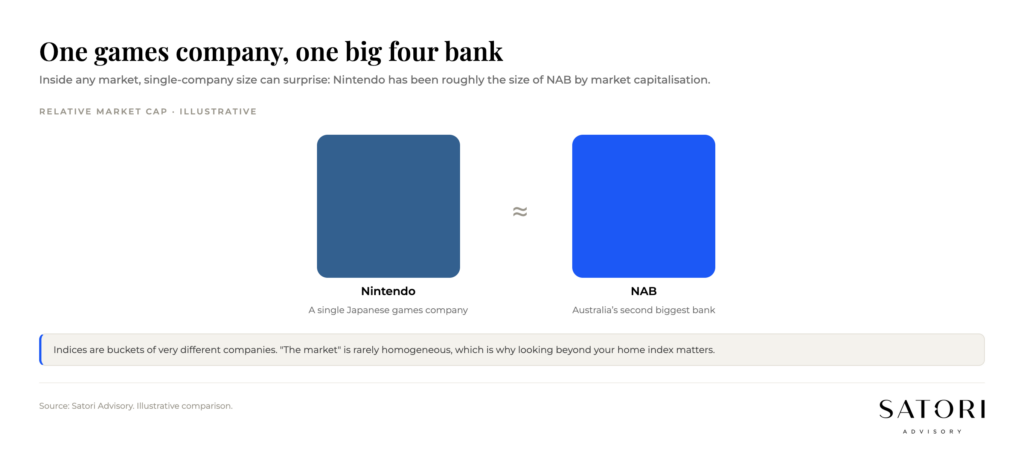
That sort of comparison is hard to imagine if you only think in headlines. It also tells you something useful: indices are buckets of very different businesses, with very different drivers, all stitched together under one number. Two investors with ‘the same exposure’ to a region can end up with quite different outcomes depending on which sub-segments they actually own.
What this means for an Australian investor
If you hold global equity exposure (directly, through ETFs, or inside super), it is worth understanding what is actually in there. The leader rotates. The composition matters. And single-name concentration can hide inside a passive vehicle if you do not look.
What to do next
Pull a fact sheet for one global equity holding you own. Look at the top 10 names. Ask whether the regional and single-name exposure inside it is consistent with how you describe your portfolio out loud.
If you would like a calm second view on what your global equity exposure actually contains, we can run that check with you in a complimentary initial chat.
How Satori Advisory works
At Satori Advisory we energise every part of your financial world. We integrate your tax, business, wealth and lending as a prosperity engine, aligned with what matters most to you. With a clear roadmap, informed by data and backed by decades of strategic experience, we simplify the complex. Looking beyond the headline index into what your portfolio actually contains is part of how that integration works in practice. We do not offer pre-packaged solutions. We deliver tailored, end-to-end advice that reflects your reality and ambitions. You work directly with senior advisers who listen deeply, think boldly and act with purpose, supported by our trusted team and curated network of financial and business specialists, so you can realise your potential, powered by numbers.
Frequently asked questions
Which global sharemarket has the best 12-month return?
Leadership rotates. At one point Japan’s TOPIX has led on a 12-month basis among the major indices. The leader this year is rarely the leader next year.
Why does it matter what companies are inside an index?
Indices are buckets of very different businesses with very different drivers. Single-name concentration can hide inside a passive vehicle if you do not look. Two investors with ‘the same exposure’ can end up with very different outcomes depending on what they actually own.
How can I check what is inside a global equity holding?
Pull the fact sheet for the holding (the issuer publishes one for every ETF or fund). Look at the top 10 names, the country and sector exposures, and how they compare to how you describe your portfolio.
Ready to talk?
If you would like a calm, no-pressure conversation about what your global equity exposure actually contains, we would be glad to set one up.
Please feel free to get in touch on 1300 925 081 or send an email to [email protected] if you’d like to book in a chat on the above or on other matters.
Disclaimer
This article contains general information only and has been prepared without considering your objectives, financial situation or needs. It is not personal financial advice, taxation advice or legal advice and should not be relied upon when making financial decisions. Before acting on any information, consider its appropriateness to your circumstances and seek professional advice where appropriate.