
Table of Contents
Every few years, political risk dominates the conversation in our office. Clients ask, sensibly, whether their portfolio should be repositioned around the next election. The honest answer is usually: less than the headlines suggest, more than zero. The trick is knowing which parts of politics actually move portfolios and which parts are just noise.
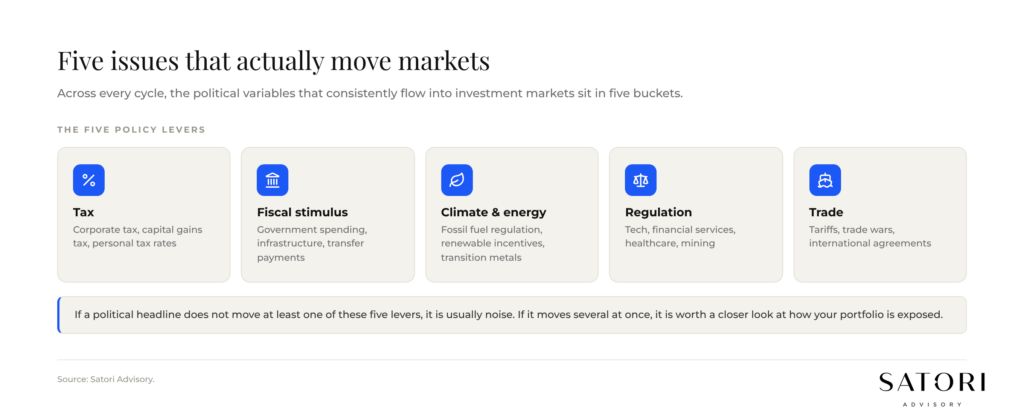
Five issues that actually move markets
Across every cycle we have lived through, the political variables that consistently flow into investment markets sit in five buckets:
- Tax (corporate tax, capital gains tax, personal tax rates).
- Fiscal stimulus (government spending, infrastructure, transfer payments).
- Climate and energy policy (regulation of fossil fuels, incentives for renewables, demand for transition metals).
- Regulation of specific industries (tech, financial services, healthcare, mining).
- Trade (tariffs, trade wars, international agreements).
If a political headline does not move at least one of those five levers, it is usually noise. If it moves several at once, it is worth a closer look at how your portfolio is exposed.
Configuration of power matters more than the leader
The most useful lens we use is not ‘who won’ but ‘who controls what’.
A divided government, where the presidency sits with one party and one or both chambers of the legislature sit with the other, tends to limit big swings in policy. Tax hikes are watered down. Stimulus packages get negotiated. Regulation moves slowly. Investment markets, broadly, tend to like that constraint, because surprise is reduced.
Unified government can also produce strong markets, but it raises the range of possible outcomes. Larger fiscal packages and bolder regulation become more likely, in both directions.
What the historical data shows
Dr Shane Oliver, in his commentary published 8 November 2020, set out a useful frame using S&P 500 data going back to 1927:
- US shares have averaged 14.6% pa under Democrat presidents.
- US shares have averaged 9.8% pa under Republican presidents.
- The single best average (16.4% pa) has occurred when there has been a Democrat president and Republican control of either the House, the Senate or both.
- By contrast, when the Republicans have controlled the presidency and Congress, the average has been 8.9% pa.
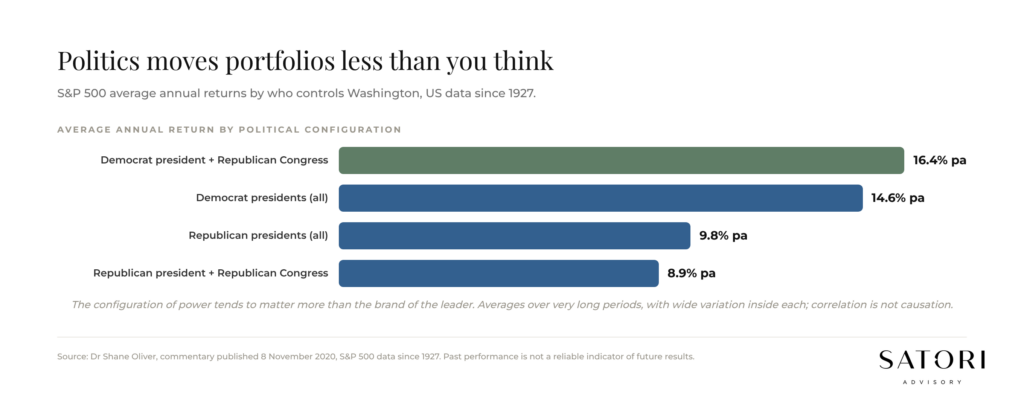
Two cautions are important. First, these are averages over very long periods, with wide variation inside each. Second, correlation is not causation. There are far more variables (interest rates, productivity, demographics, technology cycles) than the political configuration alone. Even so, the pattern is consistent enough to deserve a place in the analysis.
Sector-policy mapping in practice
Below the headline question of ‘who wins’, the more practical work is sector-by-sector. A few examples from recent cycles:
- Climate policy that moves capital toward renewables tends to raise demand for lithium, copper and other transition metals. That has direct implications for parts of the Australian resources sector.
- Climate policy that tightens regulation on fossil fuel extractors has been less kind, historically, to large diversified miners and energy producers.
- Trade policy tends to flow straight into Australian exporters, particularly those exposed to China. A tone-down of trade tensions has typically helped. An escalation has typically hurt.
- Tax policy on corporates flows into earnings. Personal tax policy flows into consumption.
The point of mapping these is not to time the market on each election. The point is to know where your portfolio is most sensitive, so that any adjustment is deliberate rather than reactive.
How Australian portfolios should think about this
Three principles seem to hold up across cycles, drawing on the AFR and WSJ analysis we read week in, week out:
- Diversification absorbs more political risk than prediction does. A portfolio that is diversified across geographies, sectors and currencies will absorb most political shocks far better than one positioned around a particular outcome.
- Long horizons mute political noise. Over five to ten years, productivity, demographics and earnings dominate. Politics is the volatility along the way.
- The seasonal point still applies. As Dr Oliver noted, markets have historically performed well in the months immediately after a close election, regardless of which side won. The ‘just sell because of the election’ instinct has rarely paid.
What to do next
Three practical steps for Australian investors at any moment in the political cycle:
- Identify which of the five policy levers (tax, fiscal, climate, regulation, trade) your portfolio is most exposed to right now.
- Note the current configuration of power in the markets that matter to you (Australia, US, China), and whether the result is divided or unified.
- Decide in advance which scenarios would actually warrant a portfolio change, and which are noise. Write it down before the next headline arrives.
That work tends to do more for long-term returns than any prediction about who will win the next election.
How Satori Advisory works
At Satori Advisory we energise every part of your financial world. We integrate your tax, business, wealth and lending as a prosperity engine, aligned with what matters most to you. With a clear roadmap, informed by data and backed by decades of strategic experience, we simplify the complex. We do not offer pre-packaged solutions. We deliver tailored, end-to-end advice that reflects your reality and ambitions. You work directly with senior advisers who listen deeply, think boldly and act with purpose, supported by our trusted team and curated network of financial and business specialists, so you can realise your potential, powered by numbers.
Frequently asked questions
Does politics actually affect long-term investment returns?
Politics affects markets in the short term, less than headlines suggest over the long term. Tax, fiscal stimulus, climate, regulation and trade are the policy levers that flow most directly into earnings and sector flows. Over long horizons, productivity, demographics and interest rates tend to dominate.
What does ‘divided government’ mean for investors?
Divided government refers to a configuration where the presidency sits with one party and one or both chambers of the legislature sit with the other. It typically constrains the biggest swings in policy. Investment markets tend to like that constraint, because the range of possible outcomes is narrower.
What do historical S&P returns show by political configuration?
Per Dr Shane Oliver (8 November 2020), since 1927 US shares have averaged 14.6% pa under Democrat presidents and 9.8% under Republican presidents. The single best average (16.4% pa) has occurred when there has been a Democrat president and Republican control of Congress. Republican president plus Republican-controlled Congress has averaged 8.9% pa.
Should I reposition my portfolio around an election?
In most cases, no. The historical pattern is that ‘sell because of the election’ instinct has rarely paid. A diversified portfolio absorbs more political risk than prediction does. Decide in advance which scenarios would actually warrant a change, and which are noise.
Ready to talk?
If you would like a calm, no-pressure conversation about how political risk is showing up in your portfolio and what (if anything) it warrants, we would be glad to set one up.
Please feel free to get in touch on 1300 925 081 or send an email to [email protected] if you’d like to book in a chat on the above or on other matters.
Disclaimer
This article contains general information only and has been prepared without considering your objectives, financial situation or needs. It is not personal financial advice, taxation advice or legal advice and should not be relied upon when making financial decisions. Before acting on any information, consider its appropriateness to your circumstances and seek professional advice where appropriate.